Pitney Bowes 2014 Annual Report Download - page 75
Download and view the complete annual report
Please find page 75 of the 2014 Pitney Bowes annual report below. You can navigate through the pages in the report by either clicking on the pages listed below, or by using the keyword search tool below to find specific information within the annual report.-
 1
1 -
2
-
3
-
4
-
5
-
6
-
7
-
8
-
9
-
10
-
11
-
12
-
13
-
14
-
15
-
16
-
17
-
18
-
19
-
20
-
21
-
22
-
23
-
24
-
25
-
26
-
27
-
28
-
29
-
30
-
31
-
32
-
33
-
34
-
35
-
36
-
37
-
38
-
39
-
40
-
41
-
42
-
43
-
44
-
45
-
46
-
47
-
48
-
49
-
50
-
51
-
52
-
53
-
54
-
55
-
56
-
57
-
58
-
59
-
60
-
61
-
62
-
63
-
64
-
 65
65 -
 66
66 -
 67
67 -
 68
68 -
 69
69 -
 70
70 -
 71
71 -
 72
72 -
 73
73 -
 74
74 -
 75
75 -
 76
76 -
 77
77 -
 78
78 -
 79
79 -
 80
80 -
 81
81 -
 82
82 -
 83
83 -
 84
84 -
 85
85 -
86
-
87
-
88
-
89
-
90
-
91
-
92
-
93
-
94
-
95
-
96
-
97
-
98
-
99
-
100
-
101
-
102
-
103
-
104
-
105
-
106
-
107
-
108
 |
 |

PITNEY BOWES INC.
NOTES TO CONSOLIDATED FINANCIAL STATEMENTS
(Tabular dollars in thousands, except per share amounts)
65
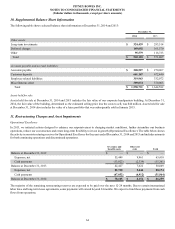
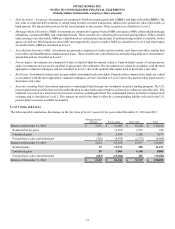
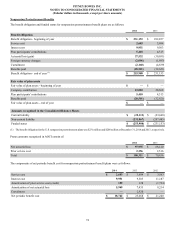
Other Plans
Other plans include workforce reduction actions taken in 2012 and strategic transformation initiatives announced in 2009 that were
implemented over a three year period. The table below shows the activity in our restructuring reserves for these other plans for the years
ended December 31, 2014, 2013 and 2012 and includes amounts for both continuing operations and discontinued operations.
Severance and
benefits costs
Other exit
costs Total
Balance at December 31, 2011 $ 105,036 $ 14,075 $ 119,111
Expenses, net 24,992 (1,627) 23,365
Cash payments (67,488)(7,230) (74,718)
Balance at December 31, 2012 62,540 5,218 67,758
Expenses, net (7,076) — (7,076)
Cash payments (39,333)(4,826) (44,159)
Balance at December 31, 2013 16,131 392 16,523
Expenses, net (8,405) — (8,405)
Cash payments (3,995)(203) (4,198)
Balance at December 31, 2014 $ 3,731 $ 189 $ 3,920
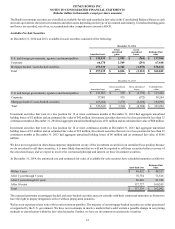
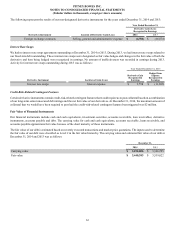
Asset Impairments
In 2013, we entered into an agreement to sell our corporate headquarters building and recorded a non-cash impairment charge of $26
million to write-down the carrying value of the building to its fair value. The fair value was determined based on the estimated selling
price less the costs to sell. The inputs used to determine the fair value were classified as Level 3. The impairment charge was included
as restructuring charges and asset impairments, net in the Consolidated Statements of Income.
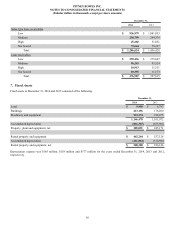
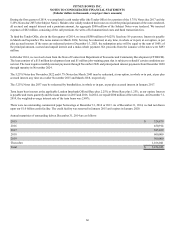
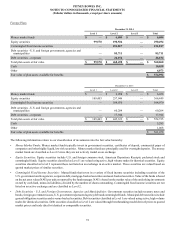
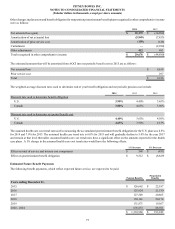
12. Debt
December 31,
Interest rate 2014 2013
Notes due March 2015 5.0% $ 274,879 $ 274,879
Notes due January 2016 4.75% 370,914 370,914
Notes due September 2017 5.75% 385,109 500,000
Notes due March 2018 5.6% 250,000 250,000
Notes due May 2018 4.75% 350,000 350,000
Notes due March 2019 6.25% 300,000 300,000
Notes due November 2022 5.25% 110,000 110,000
Notes due March 2024 4.625% 500,000 —
State of CT DECD loan due November 2024 2.0% 16,000 —
Notes due January 2037 5.25% 115,041 500,000
Notes due March 2043 6.7% 425,000 425,000
Term loans Variable 130,000 230,000
Principal amount 3,226,943 3,310,793
Less: unamortized discount 6,653 5,158
Plus: unamortized interest rate swap proceeds 31,716 40,660
Total debt 3,252,006 3,346,295
Less: current portion long-term debt 324,879 —
Long-term debt $ 2,927,127 $ 3,346,295