Pitney Bowes 2014 Annual Report Download - page 47
Download and view the complete annual report
Please find page 47 of the 2014 Pitney Bowes annual report below. You can navigate through the pages in the report by either clicking on the pages listed below, or by using the keyword search tool below to find specific information within the annual report.-
 1
1 -
2
-
3
-
4
-
5
-
6
-
7
-
8
-
9
-
10
-
11
-
12
-
13
-
14
-
15
-
16
-
17
-
18
-
19
-
20
-
21
-
22
-
23
-
24
-
25
-
26
-
27
-
28
-
29
-
30
-
31
-
32
-
33
-
34
-
35
-
36
-
 37
37 -
 38
38 -
 39
39 -
 40
40 -
 41
41 -
 42
42 -
 43
43 -
 44
44 -
 45
45 -
 46
46 -
 47
47 -
 48
48 -
 49
49 -
 50
50 -
 51
51 -
 52
52 -
 53
53 -
 54
54 -
 55
55 -
 56
56 -
 57
57 -
58
-
59
-
60
-
61
-
62
-
63
-
64
-
65
-
66
-
67
-
68
-
69
-
70
-
71
-
72
-
73
-
74
-
75
-
76
-
77
-
78
-
79
-
80
-
81
-
82
-
83
-
84
-
85
-
86
-
87
-
88
-
89
-
90
-
91
-
92
-
93
-
94
-
95
-
96
-
97
-
98
-
99
-
100
-
101
-
102
-
103
-
104
-
105
-
106
-
107
-
108
 |
 |

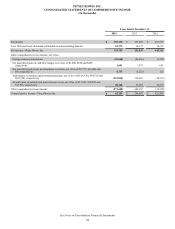
PITNEY BOWES INC.
CONSOLIDATED STATEMENTS OF INCOME
(In thousands, except per share amounts)
37
Years Ended December 31,
2014 2013 2012
Revenue:
Equipment sales $ 770,371 $ 867,593 $ 840,748
Supplies 300,040 285,730 279,104
Software 429,743 398,664 412,762
Rentals 484,629 512,493 540,689
Financing 432,859 448,906 481,177
Support services 625,135 646,657 675,246
Business services 778,727 631,292 593,987
Total revenue 3,821,504 3,791,335 3,823,713
Costs and expenses:
Cost of equipment sales 365,724 422,580 378,136
Cost of supplies 93,675 89,365 85,766
Cost of software 123,760 110,653 115,388
Cost of rentals 97,338 100,335 109,493
Financing interest expense 78,562 77,719 77,429
Cost of support services 377,003 400,038 419,891
Cost of business services 544,729 449,932 396,295
Selling, general and administrative 1,378,400 1,420,096 1,489,735
Research and development 109,931 110,412 114,250
Restructuring charges and asset impairments, net 84,560 84,344 17,176
Interest expense 95,291 114,740 115,228
Interest income (4,403) (5,472) (7,982)
Other expense, net 45,738 32,639 1,138
Total costs and expenses 3,390,308 3,407,381 3,311,943
Income from continuing operations before income taxes 431,196 383,954 511,770
Provision for income taxes 112,815 77,967 114,287
Income from continuing operations 318,381 305,987 397,483
Income (loss) from discontinued operations, net of tax 33,749 (144,777) 66,056
Net income 352,130 161,210 463,539
Less: Preferred stock dividends of subsidiaries attributable to noncontrolling interests 18,375 18,375 18,376
Net income - Pitney Bowes Inc. $ 333,755 $ 142,835 $ 445,163
Amounts attributable to common stockholders:
Net income from continuing operations $ 300,006 $ 287,612 $ 379,107
Income (loss) from discontinued operations, net of tax 33,749 (144,777) 66,056
Net income - Pitney Bowes Inc. $ 333,755 $ 142,835 $ 445,163
Basic earnings per share attributable to common stockholders (1):
Continuing operations $ 1.49 $ 1.43 $ 1.89
Discontinued operations 0.17 (0.72) 0.33
Net income - Pitney Bowes Inc. $ 1.65 $ 0.71 $ 2.22
Diluted earnings per share attributable to common stockholders (1):
Continuing operations $ 1.47 $ 1.42 $ 1.88
Discontinued operations 0.17 (0.71) 0.33
Net income - Pitney Bowes Inc. $ 1.64 $ 0.70 $ 2.21
Dividends declared per share of common stock $ 0.75 $ 0.9375 $ 1.50
(1) The sum of the earnings per share amounts may not equal the totals due to rounding.
See Notes to Consolidated Financial Statements