Pitney Bowes 2014 Annual Report Download - page 81
Download and view the complete annual report
Please find page 81 of the 2014 Pitney Bowes annual report below. You can navigate through the pages in the report by either clicking on the pages listed below, or by using the keyword search tool below to find specific information within the annual report.-
 1
1 -
2
-
3
-
4
-
5
-
6
-
7
-
8
-
9
-
10
-
11
-
12
-
13
-
14
-
15
-
16
-
17
-
18
-
19
-
20
-
21
-
22
-
23
-
24
-
25
-
26
-
27
-
28
-
29
-
30
-
31
-
32
-
33
-
34
-
35
-
36
-
37
-
38
-
39
-
40
-
41
-
42
-
43
-
44
-
45
-
46
-
47
-
48
-
49
-
50
-
51
-
52
-
53
-
54
-
55
-
56
-
57
-
58
-
59
-
60
-
61
-
62
-
63
-
64
-
65
-
66
-
67
-
68
-
69
-
70
-
 71
71 -
 72
72 -
 73
73 -
 74
74 -
 75
75 -
 76
76 -
 77
77 -
 78
78 -
 79
79 -
 80
80 -
 81
81 -
 82
82 -
 83
83 -
 84
84 -
 85
85 -
 86
86 -
 87
87 -
 88
88 -
 89
89 -
 90
90 -
 91
91 -
92
-
93
-
94
-
95
-
96
-
97
-
98
-
99
-
100
-
101
-
102
-
103
-
104
-
105
-
106
-
107
-
108
 |
 |

PITNEY BOWES INC.
NOTES TO CONSOLIDATED FINANCIAL STATEMENTS
(Tabular dollars in thousands, except per share amounts)
71
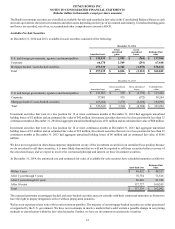
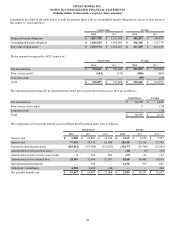
The fair value of the U.K. plan assets was $427 million and $414 million at December 31, 2014 and 2013, respectively, and the expected
long-term weighted average rate of return on these plan assets was 7.50% in 2014 and 7.38% in 2013.
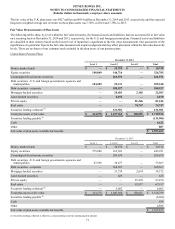
Fair Value Measurements of Plan Assets
The following tables show, by level within the fair value hierarchy, the financial assets and liabilities that are accounted for at fair value
on a recurring basis at December 31, 2014 and 2013, respectively, for the U.S. and foreign pension plans. Financial assets and liabilities
are classified in their entirety based on the lowest level of input that is significant to the fair value measurement. Our assessment of the
significance of a particular input to the fair value measurement requires judgment and may affect placement within the fair value hierarchy
levels. There are no shares of our common stock included in the plan assets of our pension plans.
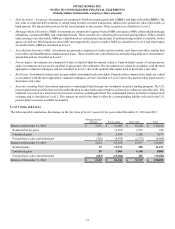
United States Pension Plans
December 31, 2014
Level 1 Level 2 Level 3 Total
Money market funds $ — $ 10,758 $ — $ 10,758
Equity securities 180,069 146,716 — 326,785
Commingled fixed income securities — 261,571 — 261,571
Debt securities - U.S. and foreign governments, agencies and
municipalities 184,209 25,131 — 209,340
Debt securities - corporate — 598,927 — 598,927
Mortgage-backed securities — 20,401 2,102 22,503
Asset-backed securities — 2,158 — 2,158
Private equity — — 81,246 81,246
Real estate — — 74,747 74,747
Securities lending collateral (1) — 131,901 — 131,901
Total plan assets at fair value $ 364,278 $ 1,197,563 $ 158,095 $ 1,719,936
Securities lending payable (1) (131,901)
Cash 4,621
Other 807
Fair value of plan assets available for benefits $ 1,593,463
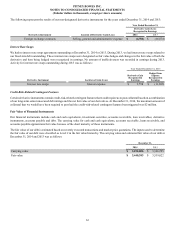
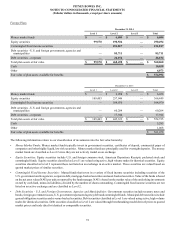
December 31, 2013
Level 1 Level 2 Level 3 Total
Money market funds $ — $ 30,374 $ — $ 30,374
Equity securities 279,988 165,303 — 445,291
Commingled fixed income securities — 209,674 — 209,674
Debt securities - U.S. and foreign governments, agencies and
municipalities 43,390 30,477 — 73,867
Debt securities - corporate — 568,567 — 568,567
Mortgage-backed securities — 31,738 2,634 34,372
Asset-backed securities — 625 — 625
Private equity — — 87,470 87,470
Real estate — — 67,917 67,917
Securities lending collateral (1) — 6,602 — 6,602
Total plan assets at fair value $ 323,378 $ 1,043,360 $ 158,021 $ 1,524,759
Securities lending payable (1) (6,602)
Cash 634
Other 4,888
Fair value of plan assets available for benefits $ 1,523,679
(1) Securities lending collateral is offset by a corresponding securities lending payable amount.