Pitney Bowes 2014 Annual Report Download - page 64
Download and view the complete annual report
Please find page 64 of the 2014 Pitney Bowes annual report below. You can navigate through the pages in the report by either clicking on the pages listed below, or by using the keyword search tool below to find specific information within the annual report.-
 1
1 -
2
-
3
-
4
-
5
-
6
-
7
-
8
-
9
-
10
-
11
-
12
-
13
-
14
-
15
-
16
-
17
-
18
-
19
-
20
-
21
-
22
-
23
-
24
-
25
-
26
-
27
-
28
-
29
-
30
-
31
-
32
-
33
-
34
-
35
-
36
-
37
-
38
-
39
-
40
-
41
-
42
-
43
-
44
-
45
-
46
-
47
-
48
-
49
-
50
-
51
-
52
-
53
-
 54
54 -
 55
55 -
 56
56 -
 57
57 -
 58
58 -
 59
59 -
 60
60 -
 61
61 -
 62
62 -
 63
63 -
 64
64 -
 65
65 -
 66
66 -
 67
67 -
 68
68 -
 69
69 -
 70
70 -
 71
71 -
 72
72 -
 73
73 -
 74
74 -
75
-
76
-
77
-
78
-
79
-
80
-
81
-
82
-
83
-
84
-
85
-
86
-
87
-
88
-
89
-
90
-
91
-
92
-
93
-
94
-
95
-
96
-
97
-
98
-
99
-
100
-
101
-
102
-
103
-
104
-
105
-
106
-
107
-
108
 |
 |

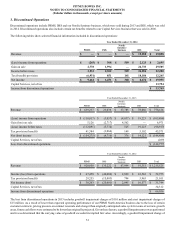
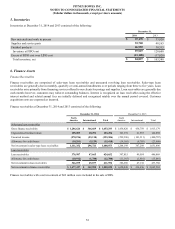
PITNEY BOWES INC.
NOTES TO CONSOLIDATED FINANCIAL STATEMENTS
(Tabular dollars in thousands, except per share amounts)
54
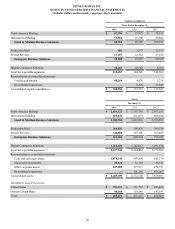
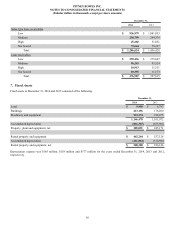
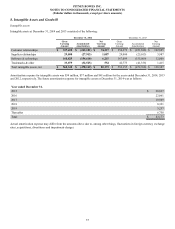
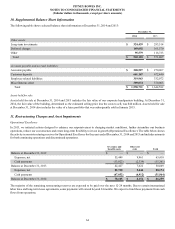
Loans receivables are due within one year. Maturities of gross sales-type lease finance receivables at December 31, 2014 were as
follows:
Sales-type Lease Receivables
North America International Total
2015 $ 580,232 $ 146,670 $ 726,902
2016 362,876 104,442 467,318
2017 214,582 67,824 282,406
2018 97,914 36,227 134,141
2019 25,497 10,760 36,257
Thereafter 5,523 746 6,269
Total $ 1,286,624 $ 366,669 $ 1,653,293
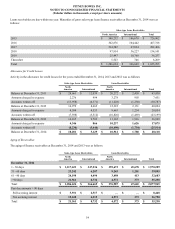
Allowance for Credit Losses
Activity in the allowance for credit losses for the years ended December 31, 2014, 2013 and 2012 was as follows:
Sales-type Lease Receivables Loan Receivables
North
America International
North
America International Total
Balance at December 31, 2011 $ 28,661 $ 12,039 $ 20,272 $ 2,458 $ 63,430
Amounts charged to expense 2,276 994 3,278 903 7,451
Accounts written off (13,958) (4,371)(11,228)(1,230) (30,787)
Balance at December 31, 2012 16,979 8,662 12,322 2,131 40,094
Amounts charged to expense 4,584 4,553 9,663 1,254 20,054
Accounts written off (7,398) (3,512)(10,820)(1,469) (23,199)
Balance at December 31, 2013 14,165 9,703 11,165 1,916 36,949
Amounts charged to expense 4,346 866 10,237 1,626 17,075
Accounts written off (8,230) (5,440)(10,490)(1,754) (25,914)
Balance at December 31, 2014 $ 10,281 $ 5,129 $ 10,912 $ 1,788 $ 28,110
Aging of Receivables
The aging of finance receivables at December 31, 2014 and 2013 was as follows:
Sales-type Lease Receivables Loan Receivables
North
America International
North
America International Total
December 31, 2014
1 - 30 days $ 1,217,623 $ 347,236 $ 359,672 $ 45,678 $ 1,970,209
31 - 60 days 23,242 6,207 9,245 1,201 39,895
61 - 90 days 24,198 4,494 3,498 413 32,603
> 90 days 21,561 8,732 4,572 373 35,238
Total $ 1,286,624 $ 366,669 $ 376,987 $ 47,665 $ 2,077,945
Past due amounts > 90 days
Still accruing interest $ 5,931 $ 2,517 $ — $ — $ 8,448
Not accruing interest 15,630 6,215 4,572 373 26,790
Total $ 21,561 $ 8,732 $ 4,572 $ 373 $ 35,238