Pitney Bowes 2014 Annual Report Download - page 79
Download and view the complete annual report
Please find page 79 of the 2014 Pitney Bowes annual report below. You can navigate through the pages in the report by either clicking on the pages listed below, or by using the keyword search tool below to find specific information within the annual report.-
 1
1 -
2
-
3
-
4
-
5
-
6
-
7
-
8
-
9
-
10
-
11
-
12
-
13
-
14
-
15
-
16
-
17
-
18
-
19
-
20
-
21
-
22
-
23
-
24
-
25
-
26
-
27
-
28
-
29
-
30
-
31
-
32
-
33
-
34
-
35
-
36
-
37
-
38
-
39
-
40
-
41
-
42
-
43
-
44
-
45
-
46
-
47
-
48
-
49
-
50
-
51
-
52
-
53
-
54
-
55
-
56
-
57
-
58
-
59
-
60
-
61
-
62
-
63
-
64
-
65
-
66
-
67
-
68
-
 69
69 -
 70
70 -
 71
71 -
 72
72 -
 73
73 -
 74
74 -
 75
75 -
 76
76 -
 77
77 -
 78
78 -
 79
79 -
 80
80 -
 81
81 -
 82
82 -
 83
83 -
 84
84 -
 85
85 -
 86
86 -
 87
87 -
 88
88 -
 89
89 -
90
-
91
-
92
-
93
-
94
-
95
-
96
-
97
-
98
-
99
-
100
-
101
-
102
-
103
-
104
-
105
-
106
-
107
-
108
 |
 |

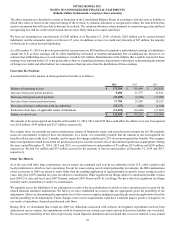
PITNEY BOWES INC.
NOTES TO CONSOLIDATED FINANCIAL STATEMENTS
(Tabular dollars in thousands, except per share amounts)
69
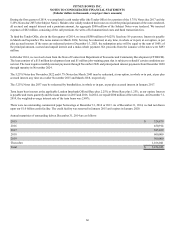
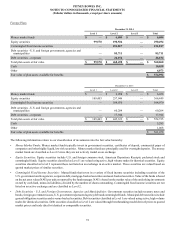
Other changes in plan assets and benefit obligations for defined benefit pension plans recognized in other comprehensive income were
as follows:
United States Foreign
2014 2013 2014 2013
Net actuarial loss (gain) $ 214,593 $(111,232)$ 61,525 $ (29,320)
Amortization of net actuarial loss (25,369)(32,494)(8,268)(14,445)
Amortization of prior service (cost) credit (9)(380)57 (112)
Net transition asset ——10 9
Settlement / curtailment (4,528)(2,638)——
Total recognized in other comprehensive income $ 184,687 $(146,744)$ 53,324 $ (43,868)
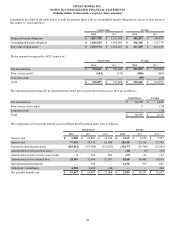
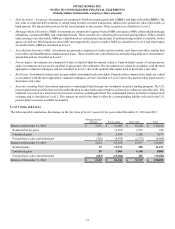
Weighted-average actuarial assumptions used to determine end of year benefit obligations and net periodic benefit cost for defined benefit
pension plans include:
2014 2013 2012
United States
Used to determine benefit obligations
Discount rate 4.15% 4.95% 4.05%
Rate of compensation increase N/A 3.50% 3.50%
Used to determine net periodic benefit cost
Discount rate 4.95% 4.05% 4.95%
Expected return on plan assets 7.00% 7.25% 7.75%
Rate of compensation increase 3.50% 3.50% 3.50%
Foreign
Used to determine benefit obligations
Discount rate 1.10% - 3.80% 1.45% - 4.60% 1.95% - 4.65%
Rate of compensation increase 1.50% - 3.50% 1.50% - 3.50% 1.50% - 3.50%
Used to determine net periodic benefit cost
Discount rate 1.45% - 4.60% 1.95% - 4.65% 1.80% - 6.10%
Expected return on plan assets 3.75% - 7.50% 3.50% - 7.50% 3.25% - 7.50%
Rate of compensation increase 1.50% - 3.50% 1.50% - 3.50% 2.10% - 4.60%
A discount rate is used to determine the present value of our future benefit obligations. The discount rate for our U.S. pension and
postretirement medical benefit plans is determined by matching the expected cash flows associated with our benefit obligations to a pool
of corporate long-term, high-quality fixed income debt instruments available as of the measurement date. The discount rate for our largest
foreign plan, the U.K. Qualified Pension Plan (the U.K. Plan), is determined by using a model that discounts each year's estimated benefit
payments by an applicable spot rate derived from a yield curve created from a large number of high quality corporate bonds. For our
other smaller foreign pension plans, the discount rate is selected based on high-quality fixed income indices available in the country in
which the plan is domiciled.
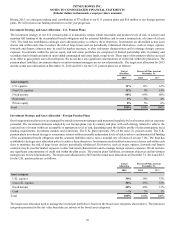
The expected return on plan assets is based on historical and expected rates of return for current and planned asset classes in the plans'
investment portfolio after analyzing historical experience and future expectations of the returns and volatility of the various asset classes.
The overall expected rate of return for the portfolio is based on the target asset allocation of our global pension plans, adjusted for historical
and expected experience of active portfolio management results, when compared to the benchmark returns. When assessing the expected
future returns for the portfolio, management places more emphasis on the expected future returns than historical returns.