Pitney Bowes 2014 Annual Report Download - page 85
Download and view the complete annual report
Please find page 85 of the 2014 Pitney Bowes annual report below. You can navigate through the pages in the report by either clicking on the pages listed below, or by using the keyword search tool below to find specific information within the annual report.-
 1
1 -
2
-
3
-
4
-
5
-
6
-
7
-
8
-
9
-
10
-
11
-
12
-
13
-
14
-
15
-
16
-
17
-
18
-
19
-
20
-
21
-
22
-
23
-
24
-
25
-
26
-
27
-
28
-
29
-
30
-
31
-
32
-
33
-
34
-
35
-
36
-
37
-
38
-
39
-
40
-
41
-
42
-
43
-
44
-
45
-
46
-
47
-
48
-
49
-
50
-
51
-
52
-
53
-
54
-
55
-
56
-
57
-
58
-
59
-
60
-
61
-
62
-
63
-
64
-
65
-
66
-
67
-
68
-
69
-
70
-
71
-
72
-
73
-
74
-
 75
75 -
 76
76 -
 77
77 -
 78
78 -
 79
79 -
 80
80 -
 81
81 -
 82
82 -
 83
83 -
 84
84 -
 85
85 -
 86
86 -
 87
87 -
 88
88 -
 89
89 -
 90
90 -
 91
91 -
 92
92 -
 93
93 -
 94
94 -
 95
95 -
96
-
97
-
98
-
99
-
100
-
101
-
102
-
103
-
104
-
105
-
106
-
107
-
108
 |
 |
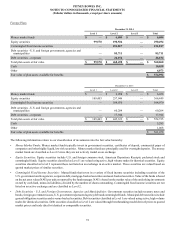
PITNEY BOWES INC.
NOTES TO CONSOLIDATED FINANCIAL STATEMENTS
(Tabular dollars in thousands, except per share amounts)
75
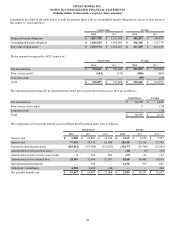
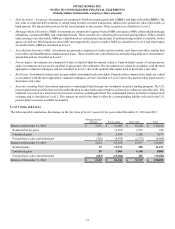
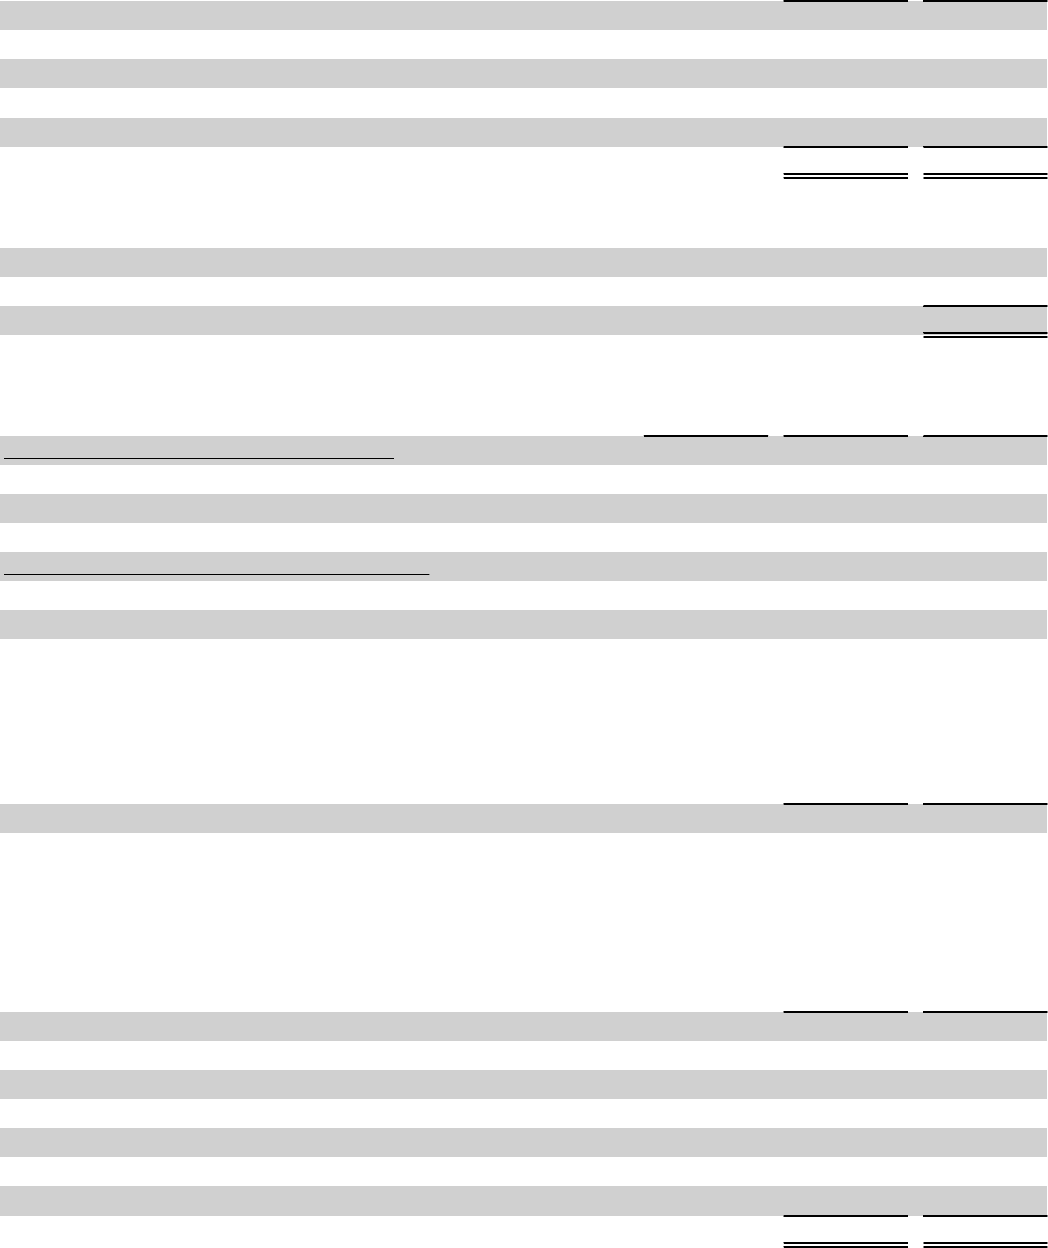
Other changes in plan assets and benefit obligation for nonpension postretirement benefit plans recognized in other comprehensive income
were as follows:
2014 2013
Net actuarial loss (gain) $ 35,372 $ (34,890)
Amortization of net actuarial loss (5,949)(7,433)
Amortization of prior service cost (159)(128)
Curtailment —(2,920)
Other adjustments 412 481
Total recognized in other comprehensive income $ 29,676 $ (44,890)
The estimated amounts that will be amortized from AOCI into net periodic benefit cost in 2015 are as follows:
Net actuarial loss $ 9,619
Prior service cost 297
Total $ 9,916
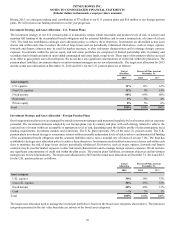
The weighted-average discount rates used to determine end of year benefit obligation and net periodic pension cost include:
2014 2013 2012
Discount rate used to determine benefit obligation
U.S. 3.90% 4.40% 3.65%
Canada 3.80% 4.65% 3.90%
Discount rate used to determine net period benefit cost
U.S. 4.40% 3.65% 4.50%
Canada 4.65% 3.90% 4.15%
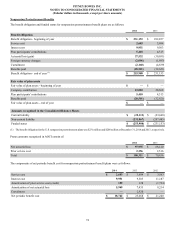
The assumed health care cost trend rate used in measuring the accumulated postretirement benefit obligation for the U.S. plan was 6.5%
for 2014 and 7.0% for 2013. The assumed health care trend rate is 6.0% for 2015 and will gradually decline to 5.0% by the year 2017
and remain at that level thereafter. Assumed health care cost trend rates have a significant effect on the amounts reported for the health
care plans. A 1% change in the assumed health care cost trend rates would have the following effects:
1% Increase 1% Decrease
Effect on total of service and interest cost components $ 548 $ (431)
Effect on postretirement benefit obligation $ 9,512 $ (8,829)
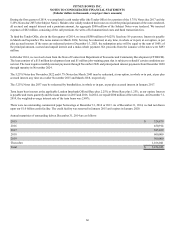
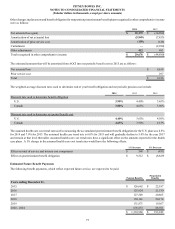
Estimated Future Benefit Payments
The following benefit payments, which reflect expected future service, are expected to be paid.
Pension Benefits
Nonpension
Benefits
Years ending December 31,
2015 $ 126,662 $ 22,187
2016 125,924 21,530
2017 127,549 20,863
2018 130,141 20,174
2019 131,871 19,567
2020 - 2024 676,833 88,921
$ 1,318,980 $ 193,242