Pitney Bowes 2014 Annual Report Download - page 95
Download and view the complete annual report
Please find page 95 of the 2014 Pitney Bowes annual report below. You can navigate through the pages in the report by either clicking on the pages listed below, or by using the keyword search tool below to find specific information within the annual report.-
 1
1 -
2
-
3
-
4
-
5
-
6
-
7
-
8
-
9
-
10
-
11
-
12
-
13
-
14
-
15
-
16
-
17
-
18
-
19
-
20
-
21
-
22
-
23
-
24
-
25
-
26
-
27
-
28
-
29
-
30
-
31
-
32
-
33
-
34
-
35
-
36
-
37
-
38
-
39
-
40
-
41
-
42
-
43
-
44
-
45
-
46
-
47
-
48
-
49
-
50
-
51
-
52
-
53
-
54
-
55
-
56
-
57
-
58
-
59
-
60
-
61
-
62
-
63
-
64
-
65
-
66
-
67
-
68
-
69
-
70
-
71
-
72
-
73
-
74
-
75
-
76
-
77
-
78
-
79
-
80
-
81
-
82
-
83
-
84
-
 85
85 -
 86
86 -
 87
87 -
 88
88 -
 89
89 -
 90
90 -
 91
91 -
 92
92 -
 93
93 -
 94
94 -
 95
95 -
 96
96 -
 97
97 -
 98
98 -
 99
99 -
 100
100 -
 101
101 -
 102
102 -
 103
103 -
 104
104 -
 105
105 -
106
-
107
-
108
 |
 |

PITNEY BOWES INC.
NOTES TO CONSOLIDATED FINANCIAL STATEMENTS
(Tabular dollars in thousands, except per share amounts)
85
We estimate the fair value of stock options using a Black-Scholes valuation model. Key assumptions used to estimate the fair value of
stock options include the volatility of our stock price, a risk-free interest rate, the expected dividend yield and expected life of the award.
Expected stock price volatility is based on historical price changes of our stock. The risk-free interest rate is based on U.S. treasuries
with a term equal to the expected option term. The expected life of the award and expected dividend yield are based on historical experience.
There were no stock options granted during 2014. In 2013, we granted 800,000 options at a weighted average exercise price of $21.93
and in 2012, we granted 600,000 options at a weighted average exercise price of $15.71.
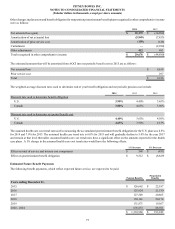
The fair value of stock options granted during 2013 and 2012 was determined using the following assumptions:
Years Ended December 31,
2013 2012
Expected dividend yield 7.7% 9.3%
Expected stock price volatility 29.5% 30.0%
Risk-free interest rate 1.8% 1.2%
Expected life 7.9 years 7.9 years
Weighted-average fair value per option granted $0.88 $0.48
Fair value of options granted (in thousands) $704 $288
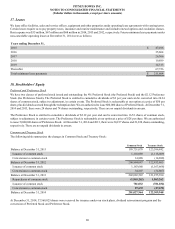
Employee Stock Purchase Plan
We maintain a non-compensatory Employee Stock Purchase Plan that enables substantially all U.S. and Canadian employees to purchase
shares of our common stock at an offering price of 95% of the average market price on the offering date. At no time will the exercise
price be less than the lowest price permitted under Section 423 of the Internal Revenue Code. Employees purchased 87,606 shares and
222,159 shares in 2014 and 2013, respectively. We have reserved 3,200,506 common shares for future purchase under the ESPP.
Directors' Stock Plan
The Directors Stock Plan was amended and restated as of May 12, 2014. Under the revised plan, non-employee directors receive restricted
stock units which are convertible into shares of common stock one year from date of grant. Under the Directors’ Stock Plan in effect for
the 2013 awards, non-employee directors received shares of stock that vested after six months. In 2014, 34,344 restricted stock units
were awarded to non-employee directors and in 2013, 19,800 shares of stock were awarded to non-employee directors.