Pitney Bowes 2014 Annual Report Download - page 32
Download and view the complete annual report
Please find page 32 of the 2014 Pitney Bowes annual report below. You can navigate through the pages in the report by either clicking on the pages listed below, or by using the keyword search tool below to find specific information within the annual report.-
 1
1 -
2
-
3
-
4
-
5
-
6
-
7
-
8
-
9
-
10
-
11
-
12
-
13
-
14
-
15
-
16
-
17
-
18
-
19
-
20
-
21
-
 22
22 -
 23
23 -
 24
24 -
 25
25 -
 26
26 -
 27
27 -
 28
28 -
 29
29 -
 30
30 -
 31
31 -
 32
32 -
 33
33 -
 34
34 -
 35
35 -
 36
36 -
 37
37 -
 38
38 -
 39
39 -
 40
40 -
 41
41 -
 42
42 -
43
-
44
-
45
-
46
-
47
-
48
-
49
-
50
-
51
-
52
-
53
-
54
-
55
-
56
-
57
-
58
-
59
-
60
-
61
-
62
-
63
-
64
-
65
-
66
-
67
-
68
-
69
-
70
-
71
-
72
-
73
-
74
-
75
-
76
-
77
-
78
-
79
-
80
-
81
-
82
-
83
-
84
-
85
-
86
-
87
-
88
-
89
-
90
-
91
-
92
-
93
-
94
-
95
-
96
-
97
-
98
-
99
-
100
-
101
-
102
-
103
-
104
-
105
-
106
-
107
-
108
 |
 |

22
compared to 2012 as higher volumes in global ecommerce parcels helped partially offset the high level of fixed costs and our continuing
investment in this business and reduced margins on equipment sales.
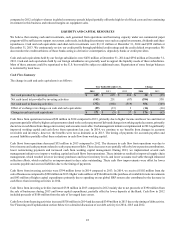
LIQUIDITY AND CAPITAL RESOURCES
We believe that existing cash and investments, cash generated from operations and borrowing capacity under our commercial paper
program will be sufficient to support our current cash needs, including discretionary uses such as capital investments, dividends and share
repurchases. Cash and cash equivalents and short-term investments were $1,111 million at December 31, 2014 and $939 million at
December 31, 2013. We continuously review our credit profile through published credit ratings and the credit default swap market. We
also monitor the creditworthiness of those banks acting as derivative counterparties, depository banks or credit providers.
Cash and cash equivalents held by our foreign subsidiaries were $470 million at December 31, 2014 and $392 million at December 31,
2013. Cash and cash equivalents held by our foreign subsidiaries are generally used to support the liquidity needs of these subsidiaries.
Most of these amounts could be repatriated to the U.S. but would be subject to additional taxes. Repatriation of some foreign balances
is restricted by local laws.
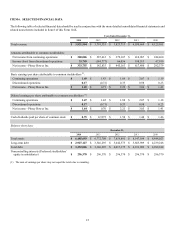
Cash Flow Summary
The change in cash and cash equivalents is as follows:
Year Ended December 31, Change
2014 2013 2012 2014 2013
Net cash provided by operating activities $ 655 $ 625 $ 660 $30
$ (35)
Net cash (used in) provided by investing activities (143)251 (87)(394)338
Net cash used in financing activities (312)(868)(519)556 (349)
Effect of exchange rate changes on cash and cash equivalents (29)(13)3
(16)(16)
Change in cash and cash equivalents $ 171 $(5)$ 57 $ 176 $ (62)
Cash flows from operations increased $30 million in 2014 compared to 2013, primarily due to higher income and lower tax and interest
payments partially offset by higher cash payments related to the early repayment of debt and changes in working capital accounts, primarily
due to lower cash flows from changes in inventory and accounts receivable. Cash management initiatives implemented in 2013 significantly
improved working capital and cash flows from operations last year. In 2014, we continue to see benefits from changes in accounts
receivable and inventory; however, the benefits were not as dramatic as in 2013. The timing of payments for accounts payables and
accrued liabilities partially offset these reductions in cash flow from working capital.
Cash flows from operations decreased $35 million in 2013 compared to 2012. The decrease in cash flow from operations was due to
lower income and cash payments related to early repayment of debt. These decreases were partially offset by lower pension contributions,
lower restructuring payments and increased cash from working capital management. During 2013, we implemented several cash
management initiatives to improve working capital and cash flows from operations. These initiatives resulted in improved supply chain
management, which resulted in lower inventory purchases and lower inventory levels, and lower accounts receivable through enhanced
collection efforts, which resulted in an improvement in days sales outstanding. These cash flow improvements were offset by lower
accounts payable and accrued liabilities due to the timing of payments.
Cash flows from investing activities were $394 million lower in 2014 compared to 2013. In 2014, we received $102 million from the
sale of businesses compared to $390 million in 2013. Higher cash outflows of $54 million for the purchase of available for sale investments
and $43 million of higher capital expenditures primarily due to spending on our global ERP system also contributed to the decrease in
cash flows from investing activities in 2014.
Cash flows from investing activities increased $338 million in 2013 compared to 2012 mainly due to net proceeds of $390 million from
the sale of businesses during 2013 and lower capital expenditures, partially offset by lower deposits at the Bank. Cash flow in 2012
included proceeds of $106 million from the sale of leveraged lease assets.
Cash flows from financing activities increased $556 million in 2014 and decreased $349 million in 2013 due to the timing of debt activity.
See Financing and Capitalization section below for a detailed discussion of our debt activity for 2014, 2013 and 2012.