Pitney Bowes 2014 Annual Report Download - page 74
Download and view the complete annual report
Please find page 74 of the 2014 Pitney Bowes annual report below. You can navigate through the pages in the report by either clicking on the pages listed below, or by using the keyword search tool below to find specific information within the annual report.-
 1
1 -
2
-
3
-
4
-
5
-
6
-
7
-
8
-
9
-
10
-
11
-
12
-
13
-
14
-
15
-
16
-
17
-
18
-
19
-
20
-
21
-
22
-
23
-
24
-
25
-
26
-
27
-
28
-
29
-
30
-
31
-
32
-
33
-
34
-
35
-
36
-
37
-
38
-
39
-
40
-
41
-
42
-
43
-
44
-
45
-
46
-
47
-
48
-
49
-
50
-
51
-
52
-
53
-
54
-
55
-
56
-
57
-
58
-
59
-
60
-
61
-
62
-
63
-
 64
64 -
 65
65 -
 66
66 -
 67
67 -
 68
68 -
 69
69 -
 70
70 -
 71
71 -
 72
72 -
 73
73 -
 74
74 -
 75
75 -
 76
76 -
 77
77 -
 78
78 -
 79
79 -
 80
80 -
 81
81 -
 82
82 -
 83
83 -
 84
84 -
85
-
86
-
87
-
88
-
89
-
90
-
91
-
92
-
93
-
94
-
95
-
96
-
97
-
98
-
99
-
100
-
101
-
102
-
103
-
104
-
105
-
106
-
107
-
108
 |
 |

PITNEY BOWES INC.
NOTES TO CONSOLIDATED FINANCIAL STATEMENTS
(Tabular dollars in thousands, except per share amounts)
64
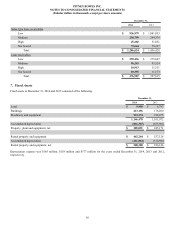
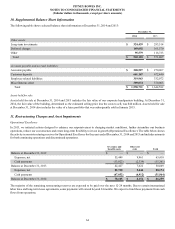
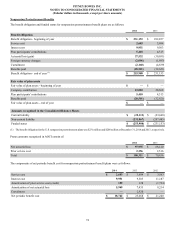
10. Supplemental Balance Sheet Information
The following table shows selected balance sheet information at December 31, 2014 and 2013:
December 31,
2014 2013
Other assets:
Long-term investments $ 324,439 $ 293,514
Deferred charges 149,092 161,570
Other 95,579 116,723
Total $ 569,110 $ 571,807
Accounts payable and accrued liabilities:
Accounts payable $ 268,527 $ 270,067
Customer deposits 661,167 672,440
Employee related liabilities 319,963 332,072
Miscellaneous other 309,074 370,003
Total $ 1,558,731 $ 1,644,582
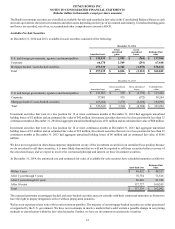
Assets held for sale
Assets held for sale at December 31, 2014 and 2013 includes the fair value of our corporate headquarters building. At December 31,
2014, the fair value of the building, determined as the estimated selling price less the costs to sell, was $44 million. Assets held for sale
at December 31, 2014 also includes the value of a lease portfolio that was subsequently sold in January 2015.
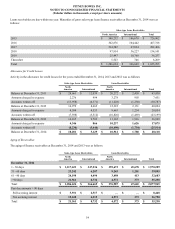
11. Restructuring Charges and Asset Impairments
Operational Excellence
In 2013, we initiated actions designed to enhance our responsiveness to changing market conditions, further streamline our business
operations, reduce our cost structure and create long-term flexibility to invest in growth (Operational Excellence). The table below shows
the activity in our restructuring reserves for Operational Excellence for the years ended December 31, 2014 and 2013 and includes amounts
for both continuing operations and discontinued operations.
Severance and
benefits costs
Other exit
costs Total
Balance at December 31, 2012 $ — $ — $ —
Expenses, net 55,449 9,961 65,410
Cash payments (13,022)(2,339) (15,361)
Balance at December 31, 2013 42,427 7,622 50,049
Expenses, net 82,730 5,444 88,174
Cash payments (47,052)(4,912) (51,964)
Balance at December 31, 2014 $ 78,105 $ 8,154 $ 86,259
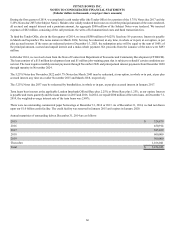
The majority of the remaining restructuring reserves are expected to be paid over the next 12-24 months. Due to certain international
labor laws and long-term lease agreements, some payments will extend beyond 24 months. We expect to fund these payments from cash
flows from operations.