Pitney Bowes 2014 Annual Report Download - page 62
Download and view the complete annual report
Please find page 62 of the 2014 Pitney Bowes annual report below. You can navigate through the pages in the report by either clicking on the pages listed below, or by using the keyword search tool below to find specific information within the annual report.-
 1
1 -
2
-
3
-
4
-
5
-
6
-
7
-
8
-
9
-
10
-
11
-
12
-
13
-
14
-
15
-
16
-
17
-
18
-
19
-
20
-
21
-
22
-
23
-
24
-
25
-
26
-
27
-
28
-
29
-
30
-
31
-
32
-
33
-
34
-
35
-
36
-
37
-
38
-
39
-
40
-
41
-
42
-
43
-
44
-
45
-
46
-
47
-
48
-
49
-
50
-
51
-
 52
52 -
 53
53 -
 54
54 -
 55
55 -
 56
56 -
 57
57 -
 58
58 -
 59
59 -
 60
60 -
 61
61 -
 62
62 -
 63
63 -
 64
64 -
 65
65 -
 66
66 -
 67
67 -
 68
68 -
 69
69 -
 70
70 -
 71
71 -
 72
72 -
73
-
74
-
75
-
76
-
77
-
78
-
79
-
80
-
81
-
82
-
83
-
84
-
85
-
86
-
87
-
88
-
89
-
90
-
91
-
92
-
93
-
94
-
95
-
96
-
97
-
98
-
99
-
100
-
101
-
102
-
103
-
104
-
105
-
106
-
107
-
108
 |
 |

PITNEY BOWES INC.
NOTES TO CONSOLIDATED FINANCIAL STATEMENTS
(Tabular dollars in thousands, except per share amounts)
52
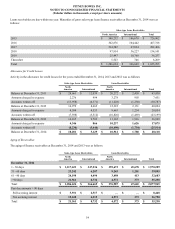
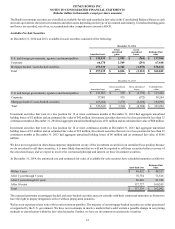
$98 million was recognized to write-down the carrying value of goodwill to its estimated implied fair value. The fair value of PBMS
North America was determined based on a combination of techniques, including external valuation data, the present value of future cash
flows and applicable multiples of competitors. These inputs were classified as Level 3 in the fair value hierarchy. In 2013, we also recorded
goodwill impairment charges of $2 million in connection with the sale of PBMS International and $1 million in connection with the sale
of the Nordic furniture business.
During 2012, in connection with our decision to exit our IMS operations, we conducted a goodwill impairment review. We determined
the fair value of IMS based on third-party written offers to purchase the business as well as applying an income approach with revised
cash flow projections. The inputs used to determine the fair value of IMS were classified as Level 3 in the fair value hierarchy. Based on
the results of our impairment test, a goodwill impairment charge of $18 million and asset impairment charges of $17 million were recorded
to write-down the carrying value of goodwill, intangible assets and other assets to their respective implied fair values.
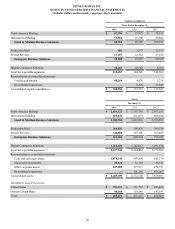
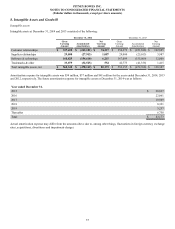
4. Earnings per Share
The calculations of basic and diluted earnings per share for the years ended December 31, 2014, 2013 and 2012 are presented below. The
sum of earnings per share amounts may not equal the totals due to rounding.
Years Ended December 31,
2014 2013 2012
Numerator:
Amounts attributable to common stockholders:
Net income from continuing operations $ 300,006 $ 287,612 $ 379,107
Income (loss) from discontinued operations 33,749 (144,777) 66,056
Net income (numerator for diluted EPS) 333,755 142,835 445,163
Less: Preference stock dividend 44 46 51
Income attributable to common stockholders (numerator for basic EPS) $ 333,711 $ 142,789 $ 445,112
Denominator (in thousands):
Weighted-average shares used in basic EPS 201,992 201,614 200,389
Effect of dilutive shares:
Preferred stock 122
Preference stock 344 381 398
Stock plans 1,624 960 577
Weighted-average shares used in diluted EPS 203,961 202,957 201,366
Basic earnings per share:
Continuing operations $ 1.49 $ 1.43 $ 1.89
Discontinued operations 0.17 (0.72) 0.33
Net income attributable to Pitney Bowes Inc. $ 1.65 $ 0.71 $ 2.22
Diluted earnings per share:
Continuing operations $ 1.47 $ 1.42 $ 1.88
Discontinued operations 0.17 (0.71) 0.33
Net income attributable to Pitney Bowes Inc. $ 1.64 $ 0.70 $ 2.21
Anti-dilutive options excluded from diluted earnings per share (in thousands): 7,322 12,448 13,801