Pitney Bowes 2014 Annual Report Download - page 27
Download and view the complete annual report
Please find page 27 of the 2014 Pitney Bowes annual report below. You can navigate through the pages in the report by either clicking on the pages listed below, or by using the keyword search tool below to find specific information within the annual report.-
 1
1 -
2
-
3
-
4
-
5
-
6
-
7
-
8
-
9
-
10
-
11
-
12
-
13
-
14
-
15
-
16
-
 17
17 -
 18
18 -
 19
19 -
 20
20 -
 21
21 -
 22
22 -
 23
23 -
 24
24 -
 25
25 -
 26
26 -
 27
27 -
 28
28 -
 29
29 -
 30
30 -
 31
31 -
 32
32 -
 33
33 -
 34
34 -
 35
35 -
 36
36 -
 37
37 -
38
-
39
-
40
-
41
-
42
-
43
-
44
-
45
-
46
-
47
-
48
-
49
-
50
-
51
-
52
-
53
-
54
-
55
-
56
-
57
-
58
-
59
-
60
-
61
-
62
-
63
-
64
-
65
-
66
-
67
-
68
-
69
-
70
-
71
-
72
-
73
-
74
-
75
-
76
-
77
-
78
-
79
-
80
-
81
-
82
-
83
-
84
-
85
-
86
-
87
-
88
-
89
-
90
-
91
-
92
-
93
-
94
-
95
-
96
-
97
-
98
-
99
-
100
-
101
-
102
-
103
-
104
-
105
-
106
-
107
-
108
 |
 |

17
that revenue growth could be challenged by the uncertain macro-economic environment in Europe, the impact on revenue from the
transition of our business in certain European countries to a dealer network and declining services revenue.
In recent months, we have seen a considerable strengthening of the U.S. dollar. A continuing strong U.S. dollar could adversely affect
our reported revenues and profitability, both from a translation perspective as well as a competitive perspective, as the cost of our
international competitors' products and solutions improves relative to our products and solutions. A strengthening dollar could also affect
the demand for U.S. goods sold to consumers in other countries through our global ecommerce solutions.
RESULTS OF OPERATIONS
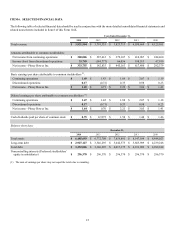
Revenue by source and the related cost of revenue are shown in the following tables:
Revenue
Year Ended December 31, % change
2014 2013 2012 2014 2013
Equipment sales $ 770 $ 868 $ 841 (11)% 3%
Supplies 300 286 279 5% 2%
Software 430 398 413 8% (3)%
Rentals 485 512 541 (5)% (5)%
Financing 433 449 481 (4)% (7)%
Support services 625 647 675 (3)% (4)%
Business services 779 631 594 23 % 6%
Total revenue $ 3,822 $ 3,791 $ 3,824 1% (1)%
Cost of revenue
Year Ended December 31,
2014 2013 2012
$ % of revenue $ % of revenue $ % of revenue
Cost of equipment sales $ 366 47.5% $ 423 48.7 % $ 378 45.0%
Cost of supplies 94 31.2% 89 31.3 % 86 30.7%
Cost of software 124 28.8% 111 27.8 % 115 28.0%
Cost of rentals 97 20.1% 100 19.6 % 110 20.3%
Financing interest expense 78 18.1% 78 17.3 % 77 16.1%
Cost of support services 377 60.3% 400 61.9 % 420 62.2%
Cost of business services 545 70.0% 450 71.3 % 396 66.7%
Total cost of revenue $ 1,681 44.0% $ 1,651 43.5 % $ 1,582 41.4%
Equipment sales
Equipment sales decreased 11% in 2014 compared to 2013. Approximately half of this decrease came from lower sales of production
mail inserters and high-speed printers and half came from lower sales in our SMB group. The decline in production mail inserters and
high-speed production printers was due to significant installations of this equipment for certain enterprise customers in 2013. In our
mailing business, equipment sales declined due to a temporary distraction from the transition to an inside sales organization and
reassignment of accounts and resources in North America, the exit of certain non-core product lines in Norway, the transition of our
business in certain European countries to a dealer network and lower sales in France. Cost of equipment sales as a percentage of equipment
sales revenue decreased to 47.5% compared to 48.7% in the prior year primarily due to the decline in sales of production printers, which
have a lower margin relative to other products.
Equipment sales increased 3% in 2013 compared to 2012. Higher sales of production printers globally and sorting equipment in North
America drove a 5% increase in equipment sales; however, lower mailing equipment sales in North America accounted for a 2% decrease
in equipment sales. Cost of equipment sales as a percentage of equipment sales revenue increased to 48.7% compared with 45.0% in the
prior year primarily due to a higher mix of production printers, which have a lower margin relative to other products.