Oracle 2014 Annual Report Download - page 91
Download and view the complete annual report
Please find page 91 of the 2014 Oracle annual report below. You can navigate through the pages in the report by either clicking on the pages listed below, or by using the keyword search tool below to find specific information within the annual report.-
 1
1 -
2
-
3
-
4
-
5
-
6
-
7
-
8
-
9
-
10
-
11
-
12
-
13
-
14
-
15
-
16
-
17
-
18
-
19
-
20
-
21
-
22
-
23
-
24
-
25
-
26
-
27
-
28
-
29
-
30
-
31
-
32
-
33
-
34
-
35
-
36
-
37
-
38
-
39
-
40
-
41
-
42
-
43
-
44
-
45
-
46
-
47
-
48
-
49
-
50
-
51
-
52
-
53
-
54
-
55
-
56
-
57
-
58
-
59
-
60
-
61
-
62
-
63
-
64
-
65
-
66
-
67
-
68
-
69
-
70
-
71
-
72
-
73
-
74
-
75
-
76
-
77
-
78
-
79
-
80
-
 81
81 -
 82
82 -
 83
83 -
 84
84 -
 85
85 -
 86
86 -
 87
87 -
 88
88 -
 89
89 -
 90
90 -
 91
91 -
 92
92 -
 93
93 -
 94
94 -
 95
95 -
 96
96 -
 97
97 -
 98
98 -
 99
99 -
 100
100 -
 101
101 -
102
-
103
-
104
-
105
-
106
-
107
-
108
-
109
-
110
-
111
-
112
-
113
-
114
-
115
-
116
-
117
-
118
-
119
-
120
-
121
-
122
-
123
-
124
-
125
-
126
-
127
-
128
-
129
-
130
-
131
-
132
-
133
-
134
-
135
-
136
-
137
-
138
-
139
-
140
-
141
-
142
-
143
-
144
-
145
-
146
-
147
-
148
-
149
-
150
-
151
-
152
-
153
-
154
-
155
-
156
-
157
-
158
-
159
-
160
-
161
-
162
-
163
-
164
-
165
 |
 |
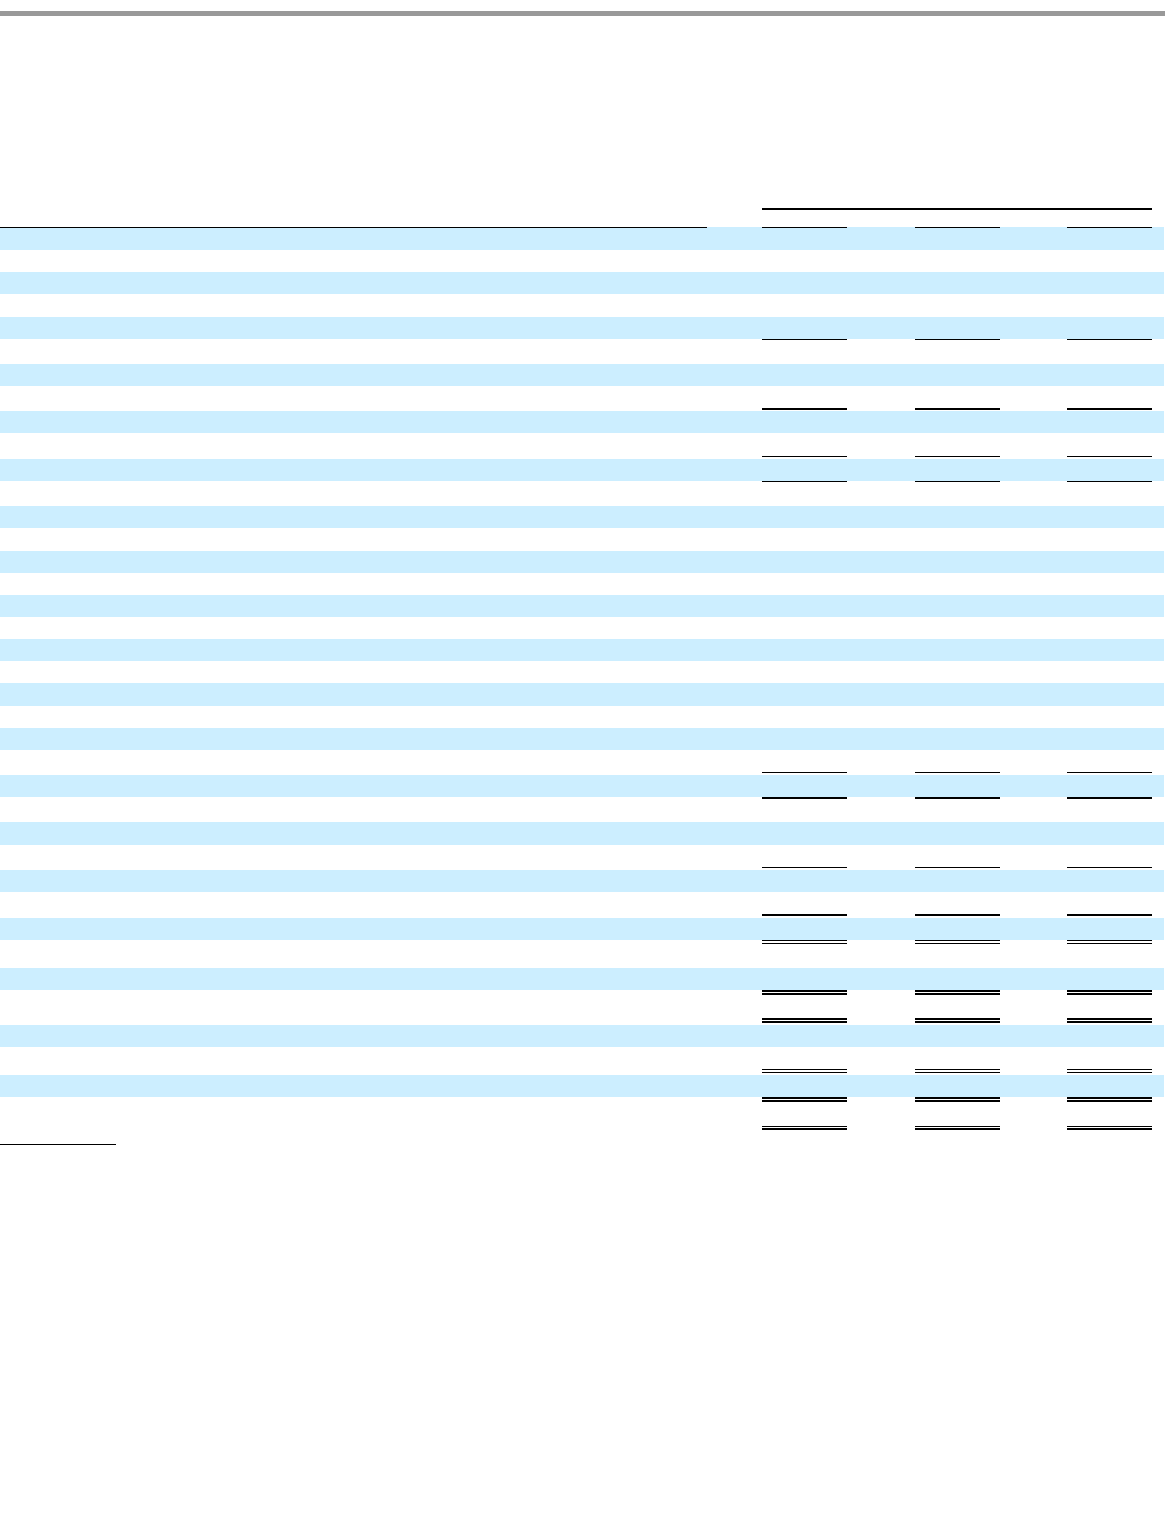
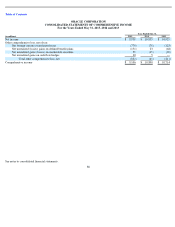
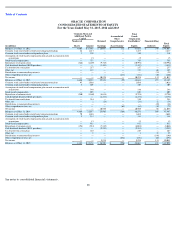
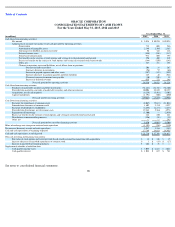
Table of Contents
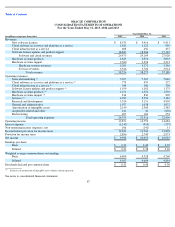
ORACLE CORPORATION
CONSOLIDATED STATEMENTS OF OPERATIONS
For the Years Ended May 31, 2015, 2014 and 2013
See notes to consolidated financial statements.
87
Year Ended May 31,
(in millions, except per share data)
2015
2014
2013
Revenues:
New software licenses
$
8,535
$
9,416
$
9,411
Cloud software as a service and platform as a service
1,485
1,121
910
Cloud infrastructure as a service
608
456
457
Software license updates and product support
18,847
18,206
17,142
Software and cloud revenues
29,475
29,199
27,920
Hardware systems products
2,825
2,976
3,033
Hardware systems support
2,380
2,396
2,313
Hardware systems revenues
5,205
5,372
5,346
Services revenues
3,546
3,704
3,914
Total revenues
38,226
38,275
37,180
Operating expenses:
Sales and marketing
7,655
7,567
7,062
Cloud software as a service and platform as a service
773
455
327
Cloud infrastructure as a service
344
308
304
Software license updates and product support
1,199
1,162
1,175
Hardware systems products
1,471
1,521
1,501
Hardware systems support
816
836
890
Services
2,929
2,954
3,182
Research and development
5,524
5,151
4,850
General and administrative
1,077
1,038
1,072
Amortization of intangible assets
2,149
2,300
2,385
Acquisition related and other
211
41
(604
)
Restructuring
207
183
352
Total operating expenses
24,355
23,516
22,496
Operating income
13,871
14,759
14,684
Interest expense
(1,143
)
(914
)
(797
)
Non
-
operating income (expense), net
106
(141
)
11
Income before provision for income taxes
12,834
13,704
13,898
Provision for income taxes
2,896
2,749
2,973
Net income
$
9,938
$
10,955
$
10,925
Earnings per share:
Basic
$
2.26
$
2.42
$
2.29
Diluted
$
2.21
$
2.38
$
2.26
Weighted average common shares outstanding:
Basic
4,404
4,528
4,769
Diluted
4,503
4,604
4,844
Dividends declared per common share
$
0.51
$
0.48
$
0.30
Exclusive of amortization of intangible assets, which is shown separately.
(1)
(1)
(1)
(1)
(1)
(1)
(1)
(1)