Oracle 2014 Annual Report Download - page 70
Download and view the complete annual report
Please find page 70 of the 2014 Oracle annual report below. You can navigate through the pages in the report by either clicking on the pages listed below, or by using the keyword search tool below to find specific information within the annual report.-
 1
1 -
2
-
3
-
4
-
5
-
6
-
7
-
8
-
9
-
10
-
11
-
12
-
13
-
14
-
15
-
16
-
17
-
18
-
19
-
20
-
21
-
22
-
23
-
24
-
25
-
26
-
27
-
28
-
29
-
30
-
31
-
32
-
33
-
34
-
35
-
36
-
37
-
38
-
39
-
40
-
41
-
42
-
43
-
44
-
45
-
46
-
47
-
48
-
49
-
50
-
51
-
52
-
53
-
54
-
55
-
56
-
57
-
58
-
59
-
 60
60 -
 61
61 -
 62
62 -
 63
63 -
 64
64 -
 65
65 -
 66
66 -
 67
67 -
 68
68 -
 69
69 -
 70
70 -
 71
71 -
 72
72 -
 73
73 -
 74
74 -
 75
75 -
 76
76 -
 77
77 -
 78
78 -
 79
79 -
 80
80 -
81
-
82
-
83
-
84
-
85
-
86
-
87
-
88
-
89
-
90
-
91
-
92
-
93
-
94
-
95
-
96
-
97
-
98
-
99
-
100
-
101
-
102
-
103
-
104
-
105
-
106
-
107
-
108
-
109
-
110
-
111
-
112
-
113
-
114
-
115
-
116
-
117
-
118
-
119
-
120
-
121
-
122
-
123
-
124
-
125
-
126
-
127
-
128
-
129
-
130
-
131
-
132
-
133
-
134
-
135
-
136
-
137
-
138
-
139
-
140
-
141
-
142
-
143
-
144
-
145
-
146
-
147
-
148
-
149
-
150
-
151
-
152
-
153
-
154
-
155
-
156
-
157
-
158
-
159
-
160
-
161
-
162
-
163
-
164
-
165
 |
 |
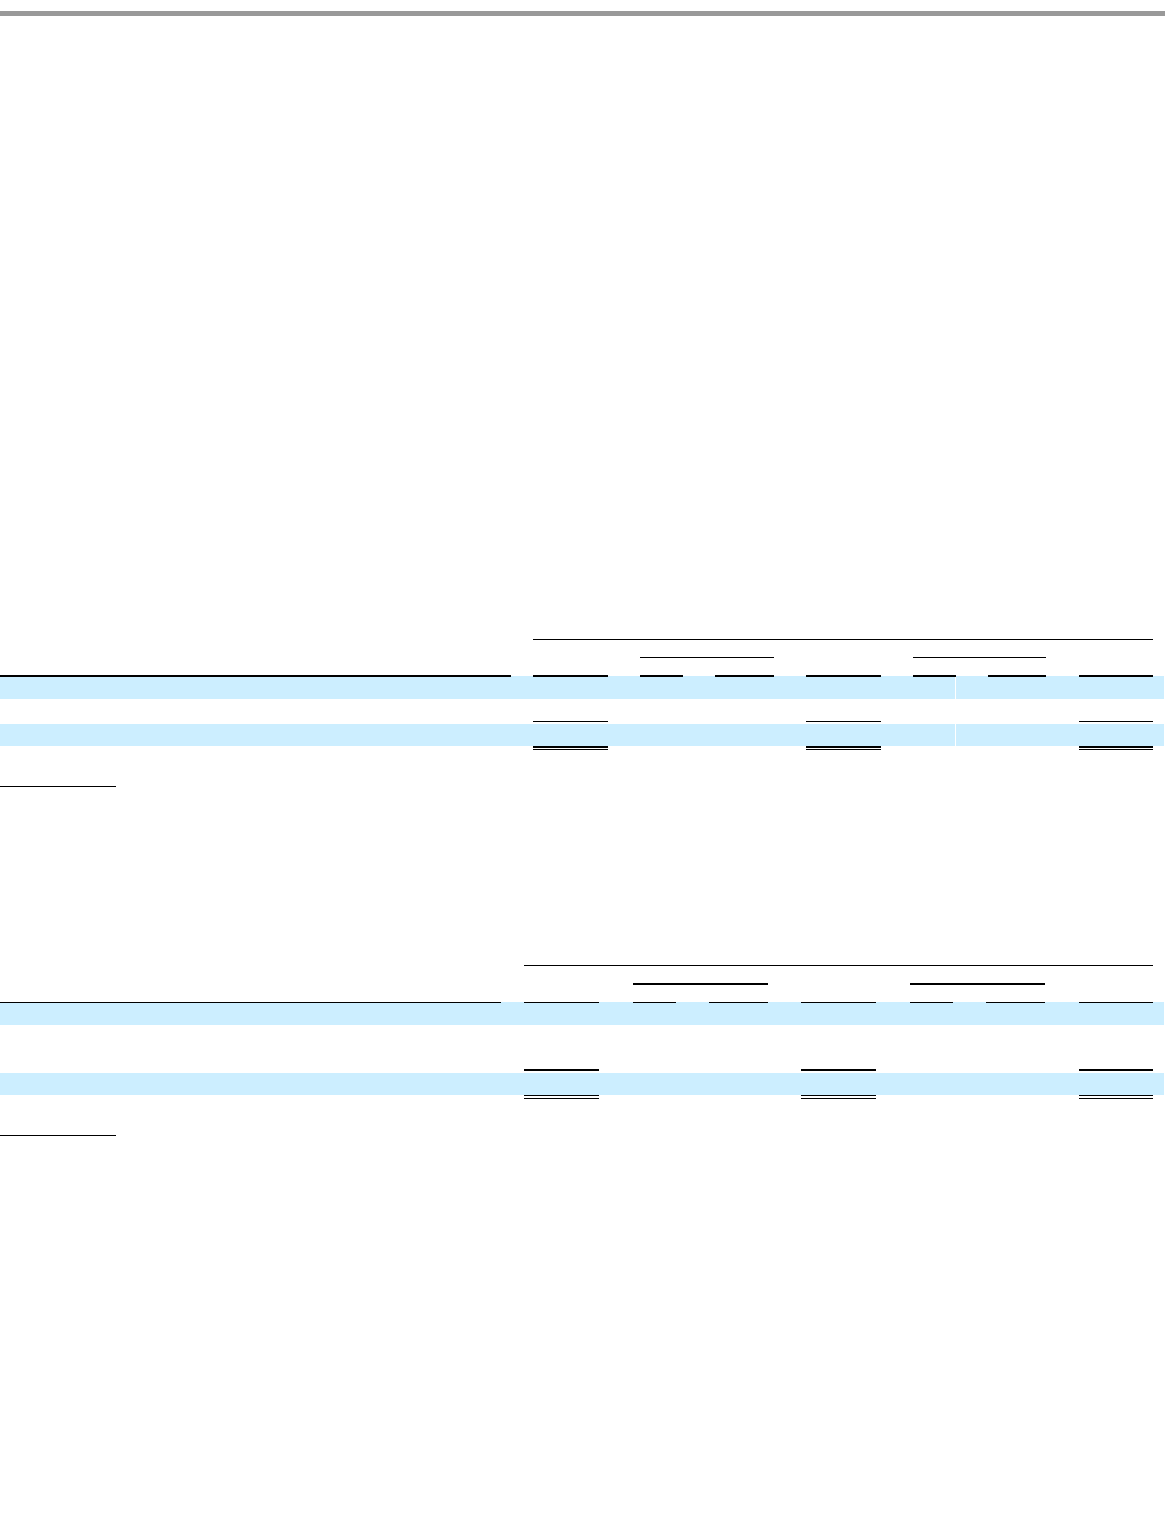
Table of Contents
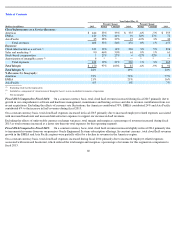
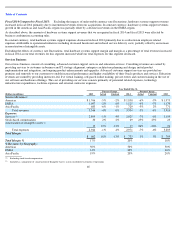
Fiscal 2015 Compared to Fiscal 2014: Excluding the effects of unfavorable currency rate fluctuations of 4 percentage points, our total
services revenues were flat in fiscal 2015 as incremental revenues from our recently acquired companies, including MICROS, and an increase in
fiscal 2015 advanced customer services revenues were offset by declines in our fiscal 2015 consulting and education revenues. In constant
currency, revenues growth in the EMEA region was offset by revenue declines in the Americas region and Asia Pacific region during fiscal
2015.
Excluding the effects of favorable currency rate fluctuations of 5 percentage points, our total services expenses increased during fiscal 2015 due
to higher employee related expenses resulting from increased headcount from our recent acquisitions and were partially offset by lower variable
compensation and lower external contractor costs, each in comparison to fiscal 2014.
In constant currency, total margin and margin as a percentage of total revenues decreased during fiscal 2015 due to the increase in total expenses
for this business.
Fiscal 2014 Compared to Fiscal 2013:
Excluding the effects of currency rate fluctuations, our total services revenues decreased in fiscal 2014
due to revenue decreases in each of our services business’ segments. The largest services revenues decrease was to our consulting segment’s
revenues.
Excluding the effects of currency rate fluctuations, our total services expenses decreased during fiscal 2014 primarily due to expense decreases
in our consulting services segment primarily due to decreased headcount, lower external contractor costs and lower intangible asset amortization.
In constant currency, total margin and margin as a percentage of total revenues increased during fiscal 2014 due to our expense reductions for
this business.
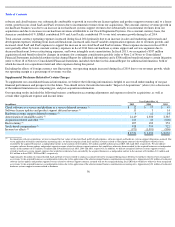
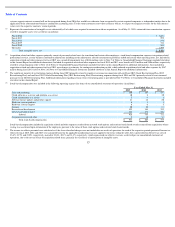
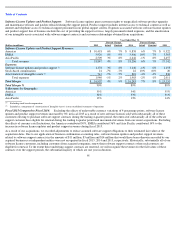
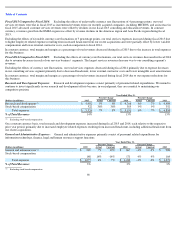
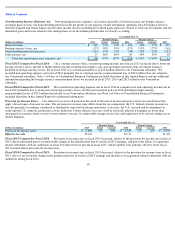
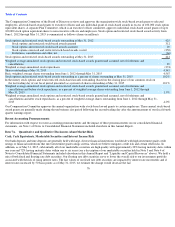
Research and Development Expenses:
Research and development expenses consist primarily of personnel related expenditures. We intend to
continue to invest significantly in our research and development efforts because, in our judgment, they are essential to maintaining our
competitive position.
On a constant currency basis, total research and development expenses increased during fiscal 2015 and 2014, each relative to the respective
prior year period, primarily due to increased employee related expenses resulting from increased headcount, including additional headcount from
our recent acquisitions.
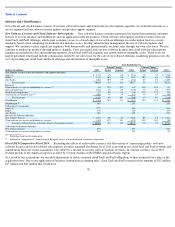
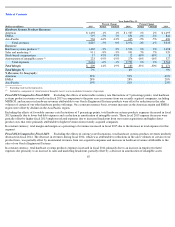
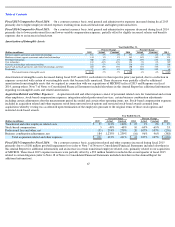
General and Administrative Expenses: General and administrative expenses primarily consist of personnel related expenditures for
information technology, finance, legal and human resources support functions.
66
Year Ended May 31,
Percent Change
Percent Change
(Dollars in millions)
2015
Actual
Constant
2014
Actual
Constant
2013
Research and development
$
5,002
5%
6%
$
4,766
6%
7%
$
4,498
Stock
-
based compensation
522
36%
36%
385
9%
9%
352
Total expenses
$
5,524
7%
8%
$
5,151
6%
7%
$
4,850
% of Total Revenues
14%
13%
13%
Excluding stock
-
based compensation
Year Ended May 31,
Percent Change
Percent Change
(Dollars in millions)
2015
Actual
Constant
2014
Actual
Constant
2013
General and administrative
$
929
7%
10%
$
867
-
4%
-
3%
$
908
Stock-based compensation
148
-
14%
-
14%
171
4%
4%
164
Total expenses
$
1,077
4%
7%
$
1,038
-
3%
-
2%
$
1,072
% of Total Revenues
3%
3%
3%
Excluding stock
-
based compensation
(1)
(1)
(1)
(1)