Oracle 2014 Annual Report Download - page 136
Download and view the complete annual report
Please find page 136 of the 2014 Oracle annual report below. You can navigate through the pages in the report by either clicking on the pages listed below, or by using the keyword search tool below to find specific information within the annual report.-
 1
1 -
2
-
3
-
4
-
5
-
6
-
7
-
8
-
9
-
10
-
11
-
12
-
13
-
14
-
15
-
16
-
17
-
18
-
19
-
20
-
21
-
22
-
23
-
24
-
25
-
26
-
27
-
28
-
29
-
30
-
31
-
32
-
33
-
34
-
35
-
36
-
37
-
38
-
39
-
40
-
41
-
42
-
43
-
44
-
45
-
46
-
47
-
48
-
49
-
50
-
51
-
52
-
53
-
54
-
55
-
56
-
57
-
58
-
59
-
60
-
61
-
62
-
63
-
64
-
65
-
66
-
67
-
68
-
69
-
70
-
71
-
72
-
73
-
74
-
75
-
76
-
77
-
78
-
79
-
80
-
81
-
82
-
83
-
84
-
85
-
86
-
87
-
88
-
89
-
90
-
91
-
92
-
93
-
94
-
95
-
96
-
97
-
98
-
99
-
100
-
101
-
102
-
103
-
104
-
105
-
106
-
107
-
108
-
109
-
110
-
111
-
112
-
113
-
114
-
115
-
116
-
117
-
118
-
119
-
120
-
121
-
122
-
123
-
124
-
125
-
 126
126 -
 127
127 -
 128
128 -
 129
129 -
 130
130 -
 131
131 -
 132
132 -
 133
133 -
 134
134 -
 135
135 -
 136
136 -
 137
137 -
 138
138 -
 139
139 -
 140
140 -
 141
141 -
 142
142 -
 143
143 -
 144
144 -
 145
145 -
 146
146 -
147
-
148
-
149
-
150
-
151
-
152
-
153
-
154
-
155
-
156
-
157
-
158
-
159
-
160
-
161
-
162
-
163
-
164
-
165
 |
 |

Table of Contents
ORACLE CORPORATION
NOTES TO CONSOLIDATED FINANCIAL STATEMENTS—(Continued)
May 31, 2015
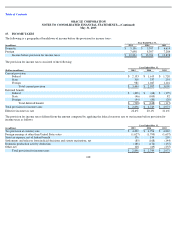
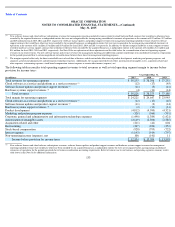
Our services business is comprised of the remainder of our operating segments and offers consulting, advanced customer support services and
education services. Our consulting line of business primarily provides services to customers in business and IT strategy alignment, enterprise
architecture planning and design, initial product implementation and integration and ongoing product enhancements and upgrades. Advanced
customer support provides support services, both on-premises and remote, to our customers to enable increased performance and higher
availability of their products and services. Education services provide training to customers, partners and employees as a part of our mission of
accelerating the adoption and use of our software and hardware products and to create opportunities to grow our product revenues.
We do not track our assets by operating segments. Consequently, it is not practical to show assets by operating segment.
The following table presents summary results for each of our three businesses and for the operating segments of our software and cloud and
hardware systems businesses:
132
Year Ended May 31,
(in millions)
2015
2014
2013
New software licenses and cloud software subscriptions:
Revenues
$
10,025
$
10,542
$
10,350
Cloud software as a service and platform as a service expenses
742
437
313
Sales and distribution expenses
5,812
5,666
5,227
Margin
$
3,471
$
4,439
$
4,810
Cloud infrastructure as a service:
Revenues
$
608
$
456
$
457
Cloud infrastructure as a service expenses
329
304
296
Sales and distribution expenses
89
61
61
Margin
$
190
$
91
$
100
Software license updates and product support:
Revenues
$
18,858
$
18,209
$
17,156
Software license updates and product support expenses
1,130
1,111
1,120
Margin
$
17,728
$
17,098
$
16,036
Total software and cloud business:
Revenues
$
29,491
$
29,207
$
27,963
Expenses
8,102
7,579
7,017
Margin
$
21,389
$
21,628
$
20,946
Hardware systems products:
Revenues
$
2,825
$
2,976
$
3,033
Hardware systems products expenses
1,465
1,516
1,498
Sales and distribution expenses
864
940
885
Margin
$
496
$
520
$
650
Hardware systems support:
Revenues
$
2,384
$
2,407
$
2,327
Hardware systems support expenses
783
802
857
Margin
$
1,601
$
1,605
$
1,470
Total hardware systems business:
Revenues
$
5,209
$
5,383
$
5,360
Expenses
3,112
3,258
3,240
Margin
$
2,097
$
2,125
$
2,120
Total services business:
Revenues
$
3,553
$
3,716
$
3,930
Services expenses
2,818
2,822
3,051
Margin
$
735
$
894
$
879
Totals:
Revenues
$
38,253
$
38,306
$
37,253
Expenses
14,032
13,659
13,308
Margin
$
24,221
$
24,647
$
23,945
(1)
(2)
(2)
(1)
(2)
(1)
(2)
(2)
(1)
(2)
(1)
(2)
(1)
(2)
(1)
(2)