Oracle 2014 Annual Report Download - page 67
Download and view the complete annual report
Please find page 67 of the 2014 Oracle annual report below. You can navigate through the pages in the report by either clicking on the pages listed below, or by using the keyword search tool below to find specific information within the annual report.-
 1
1 -
2
-
3
-
4
-
5
-
6
-
7
-
8
-
9
-
10
-
11
-
12
-
13
-
14
-
15
-
16
-
17
-
18
-
19
-
20
-
21
-
22
-
23
-
24
-
25
-
26
-
27
-
28
-
29
-
30
-
31
-
32
-
33
-
34
-
35
-
36
-
37
-
38
-
39
-
40
-
41
-
42
-
43
-
44
-
45
-
46
-
47
-
48
-
49
-
50
-
51
-
52
-
53
-
54
-
55
-
56
-
 57
57 -
 58
58 -
 59
59 -
 60
60 -
 61
61 -
 62
62 -
 63
63 -
 64
64 -
 65
65 -
 66
66 -
 67
67 -
 68
68 -
 69
69 -
 70
70 -
 71
71 -
 72
72 -
 73
73 -
 74
74 -
 75
75 -
 76
76 -
 77
77 -
78
-
79
-
80
-
81
-
82
-
83
-
84
-
85
-
86
-
87
-
88
-
89
-
90
-
91
-
92
-
93
-
94
-
95
-
96
-
97
-
98
-
99
-
100
-
101
-
102
-
103
-
104
-
105
-
106
-
107
-
108
-
109
-
110
-
111
-
112
-
113
-
114
-
115
-
116
-
117
-
118
-
119
-
120
-
121
-
122
-
123
-
124
-
125
-
126
-
127
-
128
-
129
-
130
-
131
-
132
-
133
-
134
-
135
-
136
-
137
-
138
-
139
-
140
-
141
-
142
-
143
-
144
-
145
-
146
-
147
-
148
-
149
-
150
-
151
-
152
-
153
-
154
-
155
-
156
-
157
-
158
-
159
-
160
-
161
-
162
-
163
-
164
-
165
 |
 |

Table of Contents
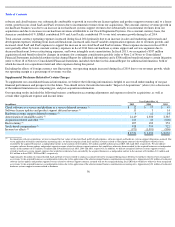
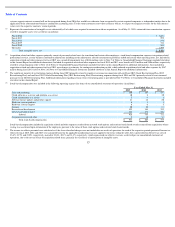
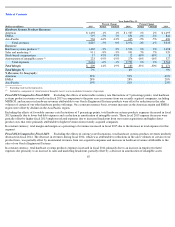
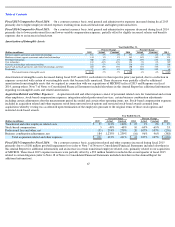
Fiscal 2015 Compared to Fiscal 2014: Excluding the effects of unfavorable currency rate fluctuations of 5 percentage points, total hardware
systems products revenues were flat in fiscal 2015 in comparison to the prior year as revenues from our recently acquired companies, including
MICROS, and increases in hardware revenues attributable to our Oracle Engineered Systems products were offset by reductions in the sales
volumes of certain of our other hardware product offerings. On a constant currency basis, revenue increases in the Americas region and EMEA
region were offset by declines in the Asia Pacific region.
Excluding the effects of favorable currency rate fluctuations of 5 percentage points, total hardware systems products expenses decreased in fiscal
2015 primarily due to lower bad debt expenses and a reduction in amortization of intangible assets. These fiscal 2015 expense decreases were
partially offset by higher fiscal 2015 employee related expenses due to increased headcount from our recent acquisitions and higher direct
product costs that were primarily attributable to higher revenues from recently acquired companies.
In constant currency, total margin and margin as a percentage of revenues increased in fiscal 2015 due to the decrease in total expenses for this
segment.
Fiscal 2014 Compared to Fiscal 2013:
Excluding the effects of currency rate fluctuations, total hardware systems products revenues modestly
decreased in fiscal 2014. The decrease in revenues during fiscal 2014, which was attributable to reductions in the sales volumes of certain of our
product lines, was partially offset by incremental revenues from our acquired companies and increases in hardware revenues attributable to the
sales of our Oracle Engineered Systems.
In constant currency, total hardware systems products expenses increased in fiscal 2014 primarily due to an increase in employee related
expenses due primarily to an increase in sales and marketing headcount, partially offset by a decrease in amortization of intangible assets.
63
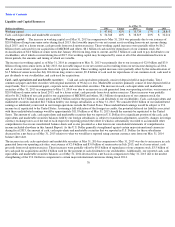
Year Ended May 31,
Percent Change
Percent Change
(Dollars in millions)
2015
Actual
Constant
2014
Actual
Constant
2013
Hardware Systems Products Revenues:
Americas
$
1,492
-
1%
1%
$
1,507
1%
2%
$
1,495
EMEA
797
-
5%
7%
834
-
1%
-
3%
842
Asia Pacific
536
-
16%
-
12%
635
-
9%
-
5%
696
Total revenues
2,825
-
5%
0%
2,976
-
2%
-
1%
3,033
Expenses:
Hardware systems products
1,465
-
3%
3%
1,516
1%
3%
1,498
Sales and marketing
911
-
8%
-
3%
991
7%
7%
929
Stock
-
based compensation
17
47%
47%
12
49%
49%
8
Amortization of intangible assets
223
-
19%
-
19%
274
-
16%
-
16%
327
Total expenses
2,616
-
6%
-
1%
2,793
1%
2%
2,762
Total Margin
$
209
14%
19%
$
183
-
33%
-
30%
$
271
Total Margin %
7%
6%
9%
% Revenues by Geography:
Americas
53%
51%
49%
EMEA
28%
28%
28%
Asia Pacific
19%
21%
23%
Excluding stock
-
based compensation
Included as a component of
‘
Amortization of Intangible Assets
’
in our consolidated statements of operations
(1)
(1)
(2)
(1)
(2)