Oracle 2014 Annual Report Download - page 72
Download and view the complete annual report
Please find page 72 of the 2014 Oracle annual report below. You can navigate through the pages in the report by either clicking on the pages listed below, or by using the keyword search tool below to find specific information within the annual report.-
 1
1 -
2
-
3
-
4
-
5
-
6
-
7
-
8
-
9
-
10
-
11
-
12
-
13
-
14
-
15
-
16
-
17
-
18
-
19
-
20
-
21
-
22
-
23
-
24
-
25
-
26
-
27
-
28
-
29
-
30
-
31
-
32
-
33
-
34
-
35
-
36
-
37
-
38
-
39
-
40
-
41
-
42
-
43
-
44
-
45
-
46
-
47
-
48
-
49
-
50
-
51
-
52
-
53
-
54
-
55
-
56
-
57
-
58
-
59
-
60
-
61
-
 62
62 -
 63
63 -
 64
64 -
 65
65 -
 66
66 -
 67
67 -
 68
68 -
 69
69 -
 70
70 -
 71
71 -
 72
72 -
 73
73 -
 74
74 -
 75
75 -
 76
76 -
 77
77 -
 78
78 -
 79
79 -
 80
80 -
 81
81 -
 82
82 -
83
-
84
-
85
-
86
-
87
-
88
-
89
-
90
-
91
-
92
-
93
-
94
-
95
-
96
-
97
-
98
-
99
-
100
-
101
-
102
-
103
-
104
-
105
-
106
-
107
-
108
-
109
-
110
-
111
-
112
-
113
-
114
-
115
-
116
-
117
-
118
-
119
-
120
-
121
-
122
-
123
-
124
-
125
-
126
-
127
-
128
-
129
-
130
-
131
-
132
-
133
-
134
-
135
-
136
-
137
-
138
-
139
-
140
-
141
-
142
-
143
-
144
-
145
-
146
-
147
-
148
-
149
-
150
-
151
-
152
-
153
-
154
-
155
-
156
-
157
-
158
-
159
-
160
-
161
-
162
-
163
-
164
-
165
 |
 |

Table of Contents
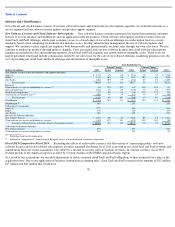
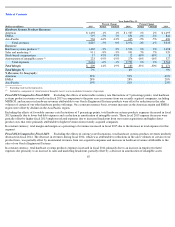
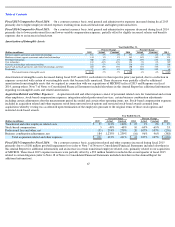
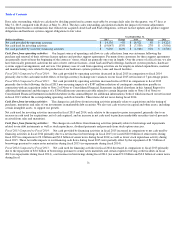
Fiscal 2014 Compared to Fiscal 2013: On a constant currency basis, the increase in our acquisition related and other expenses in fiscal 2014
was primarily due to certain benefits that we recorded during fiscal 2013, which reduced our expenses during this period. We recorded a net
benefit of $387 million during fiscal 2013 related to the change in fair value of contingent consideration payable in connection with an
acquisition (refer to Note 2 of Notes to Consolidated Financial Statements included elsewhere in this Annual Report for additional information).
We also recorded a $306 million benefit in fiscal 2013 to professional fees and other, net related to certain litigation (refer to Note 18 of Notes to
Consolidated Financial Statements included elsewhere in this Annual Report for additional information).
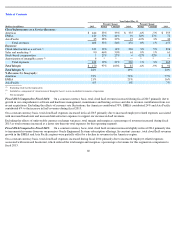
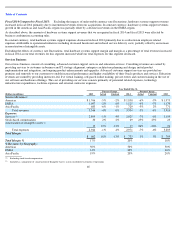
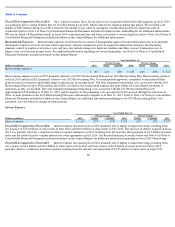
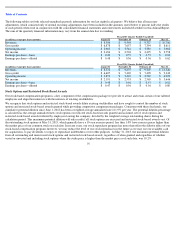
Restructuring Expenses:
Restructuring expenses result from the execution of management approved restructuring plans that were generally
developed to improve our cost structure and/or operations, often in conjunction with our acquisition integration strategies. Restructuring
expenses consist of employee severance costs and may also include charges for duplicate facilities and other contract termination costs to
improve our cost structure prospectively. For additional information regarding our restructuring plans, see Note 9 of Notes to Consolidated
Financial Statements included elsewhere in this Annual Report.
Restructuring expenses in fiscal 2015 primarily related to our 2015 Restructuring Plan and our 2013 Restructuring Plan. Restructuring expenses
in fiscal 2014 and fiscal 2013 primarily related to our 2013 Restructuring Plan. Our management approved, committed to and initiated these
plans in order to restructure and further improve efficiencies in our operations. The total estimated restructuring costs associated with the 2015
Restructuring Plan are up to $626 million and will be recorded to the restructuring expense line item within our consolidated statements of
operations as they are incurred. The total estimated remaining restructuring costs associated with the 2015 Restructuring Plan were
approximately $526 million as of May 31, 2015 and the majority of the remaining costs are expected to be incurred through the end of fiscal
2016. Actions pursuant to the 2013 Restructuring Plan were substantially complete as of May 31, 2015 (refer to Note 9 of Notes to Consolidated
Financial Statements included elsewhere in this Annual Report for additional information pertaining to our 2013 Restructuring Plan). Our
estimated costs are subject to change in future periods.
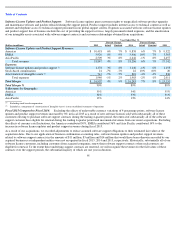
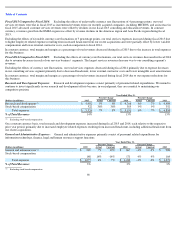
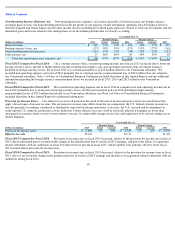
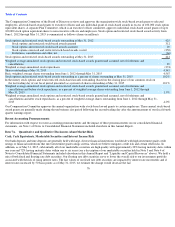
Interest Expense:
Fiscal 2015 Compared to Fiscal 2014: Interest expense increased in fiscal 2015 primarily due to higher average borrowings resulting from
our issuance of $10.0 billion of senior notes in May 2015 and $10.0 billion of senior notes in July 2014. The increase in interest expense in fiscal
2015 was partially offset by a reduction in interest expense during fiscal 2015 resulting from the maturity and repayment of $1.5 billion of senior
notes and the related fixed to variable interest rate swap agreements in July 2014. See Recent Financing Activities below and Note 8 of Notes to
Consolidated Financial Statements included elsewhere in this Annual Report for additional information regarding our fiscal 2015 borrowings.
Fiscal 2014 Compared to Fiscal 2013: Interest expense increased in fiscal 2014 primarily due to higher average borrowings resulting from
our issuance of $3.0 billion and €2.0 billion of senior notes in July 2013 and our issuance of $5.0 billion of senior notes in October 2012,
partially offset by a reduction in interest expense resulting from the maturity and repayment of $1.25 billion of senior notes in April 2013.
68
Year Ended May 31,
Percent Change
Percent Change
(Dollars in millions)
2015
Actual
Constant
2014
Actual
Constant
2013
Restructuring expenses
$
207
14%
22%
$
183
-
48%
-
49%
$
352
Year Ended May 31,
Percent Change
Percent Change
(Dollars in millions)
2015
Actual
Constant
2014
Actual
Constant
2013
Interest expense
$
1,143
25%
25%
$
914
15%
15%
$
797