Oracle 2014 Annual Report Download - page 71
Download and view the complete annual report
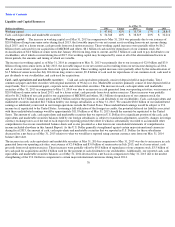
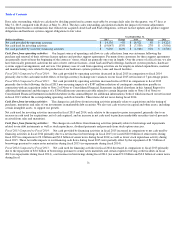
Please find page 71 of the 2014 Oracle annual report below. You can navigate through the pages in the report by either clicking on the pages listed below, or by using the keyword search tool below to find specific information within the annual report.-
 1
1 -
2
-
3
-
4
-
5
-
6
-
7
-
8
-
9
-
10
-
11
-
12
-
13
-
14
-
15
-
16
-
17
-
18
-
19
-
20
-
21
-
22
-
23
-
24
-
25
-
26
-
27
-
28
-
29
-
30
-
31
-
32
-
33
-
34
-
35
-
36
-
37
-
38
-
39
-
40
-
41
-
42
-
43
-
44
-
45
-
46
-
47
-
48
-
49
-
50
-
51
-
52
-
53
-
54
-
55
-
56
-
57
-
58
-
59
-
60
-
 61
61 -
 62
62 -
 63
63 -
 64
64 -
 65
65 -
 66
66 -
 67
67 -
 68
68 -
 69
69 -
 70
70 -
 71
71 -
 72
72 -
 73
73 -
 74
74 -
 75
75 -
 76
76 -
 77
77 -
 78
78 -
 79
79 -
 80
80 -
 81
81 -
82
-
83
-
84
-
85
-
86
-
87
-
88
-
89
-
90
-
91
-
92
-
93
-
94
-
95
-
96
-
97
-
98
-
99
-
100
-
101
-
102
-
103
-
104
-
105
-
106
-
107
-
108
-
109
-
110
-
111
-
112
-
113
-
114
-
115
-
116
-
117
-
118
-
119
-
120
-
121
-
122
-
123
-
124
-
125
-
126
-
127
-
128
-
129
-
130
-
131
-
132
-
133
-
134
-
135
-
136
-
137
-
138
-
139
-
140
-
141
-
142
-
143
-
144
-
145
-
146
-
147
-
148
-
149
-
150
-
151
-
152
-
153
-
154
-
155
-
156
-
157
-
158
-
159
-
160
-
161
-
162
-
163
-
164
-
165
 |
 |
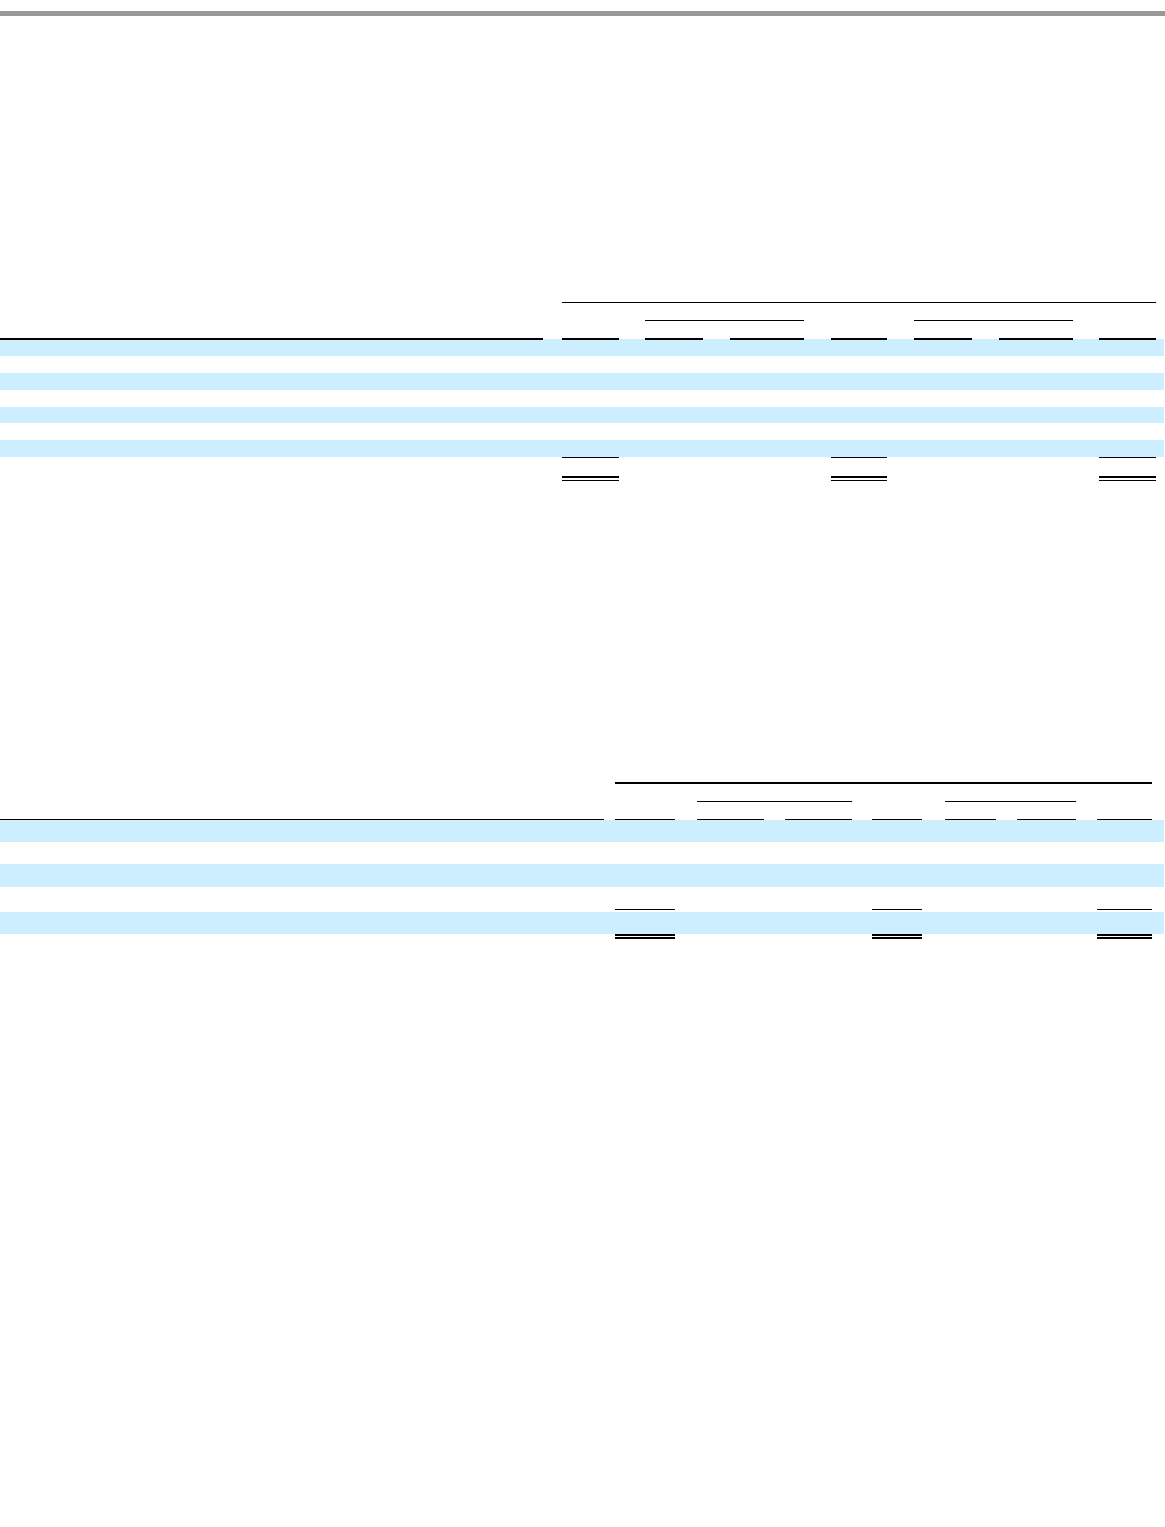
Table of Contents
Fiscal 2015 Compared to Fiscal 2014: On a constant currency basis, total general and administrative expenses increased during fiscal 2015
primarily due to higher employee related expenses resulting from increased headcount and higher professional fees.
Fiscal 2014 Compared to Fiscal 2013: On a constant currency basis, total general and administrative expenses decreased during fiscal 2014
primarily due to lower professional fees and lower variable compensation expenses, partially offset by slightly increased salaries and benefits
expenses due to an increase in headcount.
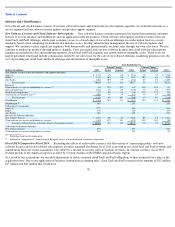
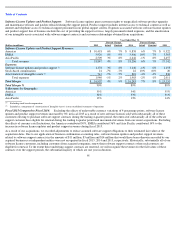
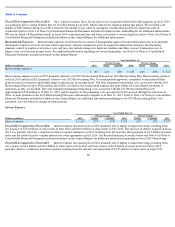
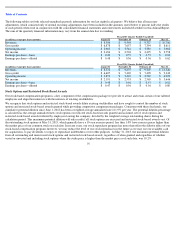
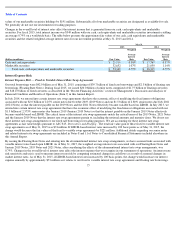
Amortization of Intangible Assets:
Amortization of intangible assets decreased during fiscal 2015 and 2014, each relative to the respective prior year period, due to a reduction in
expenses associated with certain of our intangible assets that became fully amortized. These decreases were partially offset by additional
amortization from intangible assets that we acquired in connection with our acquisitions of MICROS in fiscal 2015 and Responsys in fiscal
2014, among others. Note 7 of Notes to Consolidated Financial Statements included elsewhere in this Annual Report has additional information
regarding our intangible assets and related amortization.
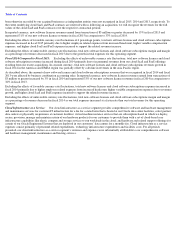
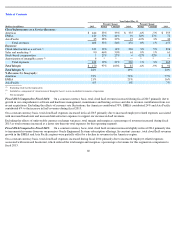
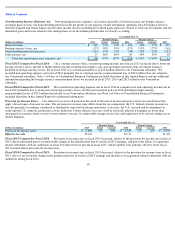
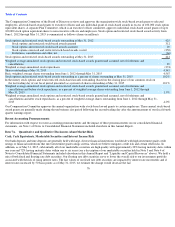
Acquisition Related and Other Expenses:
Acquisition related and other expenses consist of personnel related costs for transitional and certain
other employees, stock-based compensation expenses, integration related professional services, certain business combination adjustments
including certain adjustments after the measurement period has ended and certain other operating items, net. Stock-
based compensation expenses
included in acquisition related and other expenses result from unvested stock options and restricted stock-based awards assumed from
acquisitions whereby vesting was accelerated upon termination of the employees pursuant to the original terms of those stock options and
restricted stock-based awards.
Fiscal 2015 Compared to Fiscal 2014: On a constant currency basis, acquisition related and other expenses increased during fiscal 2015
primarily due to a $186 million goodwill impairment loss (refer to Note 7 of Notes to Consolidated Financial Statements included elsewhere in
this Annual Report for additional information) and an increase in certain transitional employee related costs, primarily related to our acquisition
of MICROS. These fiscal 2015 expense increases were partially offset by a $53 million benefit recorded in the second quarter of fiscal 2015
related to certain litigation (refer to Note 18 of Notes to Consolidated Financial Statements included elsewhere in this Annual Report for
additional information).
67
Year Ended May 31,
Percent Change
Percent Change
(Dollars in millions)
2015
Actual
Constant
2014
Actual
Constant
2013
Software support agreements and related relationships
$
531
-
7%
-
7%
$
571
-
2%
-
2%
$
582
Hardware systems support agreements and related relationships
144
1%
1%
143
18%
18%
121
Developed technology
700
-
1%
-
1%
706
-
15%
-
15%
826
Core technology
182
-
43%
-
43%
318
-
3%
-
3%
329
Customer relationships and contract backlog
312
-
7%
-
7%
334
-
5%
-
5%
350
SaaS, PaaS and IaaS agreements and related relationships and other
203
35%
35%
150
33%
33%
113
Trademarks
77
-
1%
-
1%
78
22%
22%
64
Total amortization of intangible assets
$
2,149
-
7%
-
7%
$
2,300
-
4%
-
4%
$
2,385
Year Ended May 31,
Percent Change
Percent Change
(Dollars in millions)
2015
Actual
Constant
2014
Actual
Constant
2013
Transitional and other employee related costs
$
57
112%
120%
$
27
1%
2%
$
27
Stock
-
based compensation
5
-
48%
-
48%
10
-
69%
-
69%
33
Professional fees and other, net
(35
)
274%
279%
20
107%
107%
(276
)
Business combination adjustments, net
184
1,235%
1,239%
(16
)
96%
96%
(388
)
Total acquisition related and other expenses
$
211
412%
411%
$
41
107%
107%
$
(604
)