Oracle 2014 Annual Report Download - page 112
Download and view the complete annual report
Please find page 112 of the 2014 Oracle annual report below. You can navigate through the pages in the report by either clicking on the pages listed below, or by using the keyword search tool below to find specific information within the annual report.-
 1
1 -
2
-
3
-
4
-
5
-
6
-
7
-
8
-
9
-
10
-
11
-
12
-
13
-
14
-
15
-
16
-
17
-
18
-
19
-
20
-
21
-
22
-
23
-
24
-
25
-
26
-
27
-
28
-
29
-
30
-
31
-
32
-
33
-
34
-
35
-
36
-
37
-
38
-
39
-
40
-
41
-
42
-
43
-
44
-
45
-
46
-
47
-
48
-
49
-
50
-
51
-
52
-
53
-
54
-
55
-
56
-
57
-
58
-
59
-
60
-
61
-
62
-
63
-
64
-
65
-
66
-
67
-
68
-
69
-
70
-
71
-
72
-
73
-
74
-
75
-
76
-
77
-
78
-
79
-
80
-
81
-
82
-
83
-
84
-
85
-
86
-
87
-
88
-
89
-
90
-
91
-
92
-
93
-
94
-
95
-
96
-
97
-
98
-
99
-
100
-
101
-
 102
102 -
 103
103 -
 104
104 -
 105
105 -
 106
106 -
 107
107 -
 108
108 -
 109
109 -
 110
110 -
 111
111 -
 112
112 -
 113
113 -
 114
114 -
 115
115 -
 116
116 -
 117
117 -
 118
118 -
 119
119 -
 120
120 -
 121
121 -
 122
122 -
123
-
124
-
125
-
126
-
127
-
128
-
129
-
130
-
131
-
132
-
133
-
134
-
135
-
136
-
137
-
138
-
139
-
140
-
141
-
142
-
143
-
144
-
145
-
146
-
147
-
148
-
149
-
150
-
151
-
152
-
153
-
154
-
155
-
156
-
157
-
158
-
159
-
160
-
161
-
162
-
163
-
164
-
165
 |
 |

Table of Contents
ORACLE CORPORATION
NOTES TO CONSOLIDATED FINANCIAL STATEMENTS—(Continued)
May 31, 2015
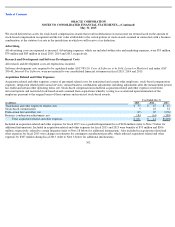
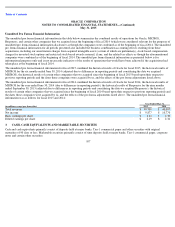
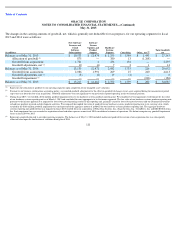
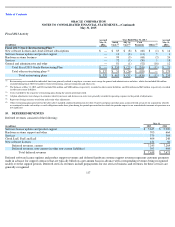
The amortized principal amounts of our cash, cash equivalents and marketable securities approximated their fair values at May 31, 2015 and
2014. We use the specific identification method to determine any realized gains or losses from the sale of our marketable securities classified as
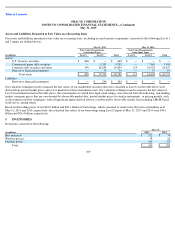
available-for-sale. Such realized gains and losses were insignificant for fiscal 2015, 2014 and 2013. The following table summarizes the
components of our cash equivalents and marketable securities held, substantially all of which were classified as available-for-sale:
As of May 31, 2015 and 2014, approximately 28% and 45%, respectively, of our marketable securities investments mature within one year and
72% and 55%, respectively, mature within one to six years. Our investment portfolio is subject to market risk due to changes in interest rates. As
described above, we limit purchases of marketable debt securities to investment grade securities, which have high credit ratings and also limit the
amount of credit exposure to any one issuer. As stated in our investment policy, we are averse to principal loss and seek to preserve our invested
funds by limiting default risk and market risk.
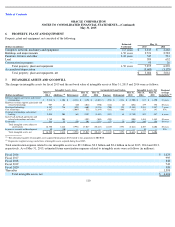
We perform fair value measurements in accordance with ASC 820. ASC 820 defines fair value as the price that would be received from selling
an asset or paid to transfer a liability in an orderly transaction between market participants at the measurement date. When determining the fair
value measurements for assets and liabilities required to be recorded at their fair values, we consider the principal or most advantageous market
in which we would transact and consider assumptions that market participants would use when pricing the assets or liabilities, such as inherent
risk, transfer restrictions and risk of nonperformance.
ASC 820 establishes a fair value hierarchy that requires an entity to maximize the use of observable inputs and minimize the use of unobservable
inputs when measuring fair value. An asset’s or a liability’s categorization within the fair value hierarchy is based upon the lowest level of input
that is significant to the fair value measurement. ASC 820 establishes three levels of inputs that may be used to measure fair value:
108
May 31,
(in millions)
2015
2014
U.S. Treasury securities
$
668
$
—
Commercial paper debt securities
9,203
7,969
Corporate debt securities and other
28,844
16,657
Total investments
$
38,715
$
24,626
Investments classified as cash equivalents
$
6,063
$
3,576
Investments classified as marketable securities
$
32,652
$
21,050
4. FAIR VALUE MEASUREMENTS
•
Level 1: quoted prices in active markets for identical assets or liabilities;
•
Level 2: inputs other than Level 1 that are observable, either directly or indirectly, such as quoted prices in active markets for similar
assets or liabilities, quoted prices for identical or similar assets or liabilities in markets that are not active, or other inputs that are
observable or can be corroborated by observable market data for substantially the full term of the assets or liabilities; or
•
Level 3: unobservable inputs that are supported by little or no market activity and that are significant to the fair values of the assets or
liabilities.