Oracle 2014 Annual Report Download - page 113
Download and view the complete annual report
Please find page 113 of the 2014 Oracle annual report below. You can navigate through the pages in the report by either clicking on the pages listed below, or by using the keyword search tool below to find specific information within the annual report.-
 1
1 -
2
-
3
-
4
-
5
-
6
-
7
-
8
-
9
-
10
-
11
-
12
-
13
-
14
-
15
-
16
-
17
-
18
-
19
-
20
-
21
-
22
-
23
-
24
-
25
-
26
-
27
-
28
-
29
-
30
-
31
-
32
-
33
-
34
-
35
-
36
-
37
-
38
-
39
-
40
-
41
-
42
-
43
-
44
-
45
-
46
-
47
-
48
-
49
-
50
-
51
-
52
-
53
-
54
-
55
-
56
-
57
-
58
-
59
-
60
-
61
-
62
-
63
-
64
-
65
-
66
-
67
-
68
-
69
-
70
-
71
-
72
-
73
-
74
-
75
-
76
-
77
-
78
-
79
-
80
-
81
-
82
-
83
-
84
-
85
-
86
-
87
-
88
-
89
-
90
-
91
-
92
-
93
-
94
-
95
-
96
-
97
-
98
-
99
-
100
-
101
-
102
-
 103
103 -
 104
104 -
 105
105 -
 106
106 -
 107
107 -
 108
108 -
 109
109 -
 110
110 -
 111
111 -
 112
112 -
 113
113 -
 114
114 -
 115
115 -
 116
116 -
 117
117 -
 118
118 -
 119
119 -
 120
120 -
 121
121 -
 122
122 -
 123
123 -
124
-
125
-
126
-
127
-
128
-
129
-
130
-
131
-
132
-
133
-
134
-
135
-
136
-
137
-
138
-
139
-
140
-
141
-
142
-
143
-
144
-
145
-
146
-
147
-
148
-
149
-
150
-
151
-
152
-
153
-
154
-
155
-
156
-
157
-
158
-
159
-
160
-
161
-
162
-
163
-
164
-
165
 |
 |

Table of Contents
ORACLE CORPORATION
NOTES TO CONSOLIDATED FINANCIAL STATEMENTS—(Continued)
May 31, 2015
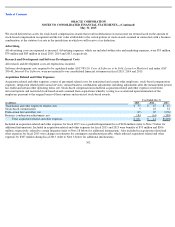
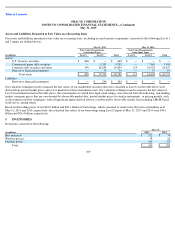
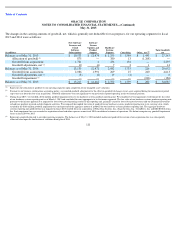
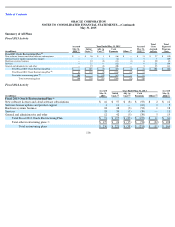
Assets and Liabilities Measured at Fair Value on a Recurring Basis
Our assets and liabilities measured at fair value on a recurring basis, excluding accrued interest components, consisted of the following (Level 1
and 2 inputs are defined above):
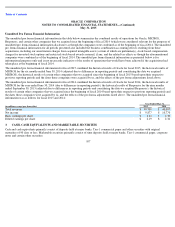
Our valuation techniques used to measure the fair values of our marketable securities that were classified as Level 1 in the table above were
derived from quoted market prices and active markets for these instruments exist. Our valuation techniques used to measure the fair values of
Level 2 instruments listed in the table above, the counterparties to which have high credit ratings, were derived from the following: non-binding
market consensus prices that are corroborated by observable market data, quoted market prices for similar instruments, or pricing models, such
as discounted cash flow techniques, with all significant inputs derived from or corroborated by observable market data including LIBOR-based
yield curves, among others.
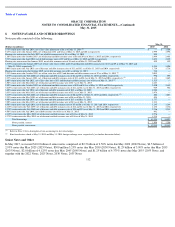
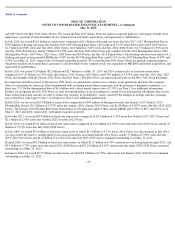
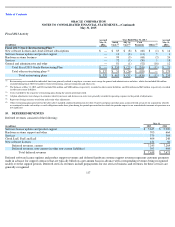
Based on the trading prices of our $42.0 billion and $24.1 billion of borrowings, which consisted of senior notes that were outstanding as of
May 31, 2015 and 2014, respectively, the estimated fair values of our borrowings using Level 2 inputs at May 31, 2015 and 2014 were $44.1
billion and $26.4 billion, respectively.
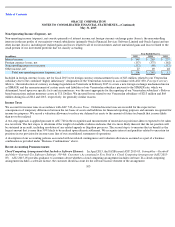
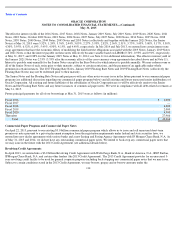
Inventories consisted of the following:
109
May 31, 2015
May 31, 2014
Fair Value Measurements
Using Input Types
Fair Value Measurements
Using Input Types
(in millions)
Level 1
Level 2
Total
Level 1
Level 2
Total
Assets:
U.S. Treasury securities
$
668
$
—
$
668
$
—
$
—
$
—
Commercial paper debt securities
—
9,203
9,203
—
7,969
7,969
Corporate debt securities and other
190
28,654
28,844
119
16,538
16,657
Derivative financial instruments
—
74
74
—
97
97
Total assets
$
858
$
37,931
$
38,789
$
119
$
24,604
$
24,723
Liabilities:
Derivative financial instruments
$
—
$
244
$
244
$
—
$
—
$
—
5. INVENTORIES
May 31,
(in millions)
2015
2014
Raw materials
$
112
$
74
Work
-
in
-
process
38
28
Finished goods
164
87
Total
$
314
$
189