Oracle 2014 Annual Report Download - page 59
Download and view the complete annual report
Please find page 59 of the 2014 Oracle annual report below. You can navigate through the pages in the report by either clicking on the pages listed below, or by using the keyword search tool below to find specific information within the annual report.-
 1
1 -
2
-
3
-
4
-
5
-
6
-
7
-
8
-
9
-
10
-
11
-
12
-
13
-
14
-
15
-
16
-
17
-
18
-
19
-
20
-
21
-
22
-
23
-
24
-
25
-
26
-
27
-
28
-
29
-
30
-
31
-
32
-
33
-
34
-
35
-
36
-
37
-
38
-
39
-
40
-
41
-
42
-
43
-
44
-
45
-
46
-
47
-
48
-
 49
49 -
 50
50 -
 51
51 -
 52
52 -
 53
53 -
 54
54 -
 55
55 -
 56
56 -
 57
57 -
 58
58 -
 59
59 -
 60
60 -
 61
61 -
 62
62 -
 63
63 -
 64
64 -
 65
65 -
 66
66 -
 67
67 -
 68
68 -
 69
69 -
70
-
71
-
72
-
73
-
74
-
75
-
76
-
77
-
78
-
79
-
80
-
81
-
82
-
83
-
84
-
85
-
86
-
87
-
88
-
89
-
90
-
91
-
92
-
93
-
94
-
95
-
96
-
97
-
98
-
99
-
100
-
101
-
102
-
103
-
104
-
105
-
106
-
107
-
108
-
109
-
110
-
111
-
112
-
113
-
114
-
115
-
116
-
117
-
118
-
119
-
120
-
121
-
122
-
123
-
124
-
125
-
126
-
127
-
128
-
129
-
130
-
131
-
132
-
133
-
134
-
135
-
136
-
137
-
138
-
139
-
140
-
141
-
142
-
143
-
144
-
145
-
146
-
147
-
148
-
149
-
150
-
151
-
152
-
153
-
154
-
155
-
156
-
157
-
158
-
159
-
160
-
161
-
162
-
163
-
164
-
165
 |
 |

Table of Contents
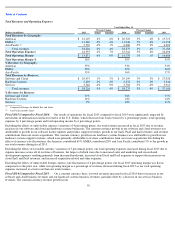
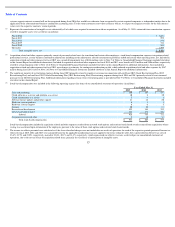
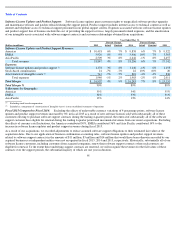
Total Revenues and Operating Expenses
Fiscal 2015 Compared to Fiscal 2014: Our results of operations for fiscal 2015 compared to fiscal 2014 were significantly impacted by
movements in international currencies relative to the U.S. Dollar, which decreased our total revenues by 4 percentage points, total operating
expenses by 3 percentage points and total operating income by 6 percentage points.
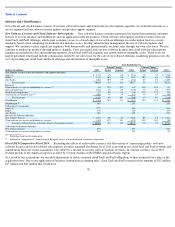
Excluding the effects of unfavorable currency variations of 4 percentage points, our total revenues increased in fiscal 2015 due to revenue
increases in our software and cloud and hardware systems businesses. The constant currency growth in our software and cloud revenues was
attributable to growth in our software license updates and product support revenues, growth in our SaaS, PaaS and IaaS revenues, and revenue
contributions from our recent acquisitions. The constant currency growth in our hardware systems business was attributable to growth in our
hardware systems support revenues, which were primarily attributable to revenue contributions from our recent acquisitions. Excluding the
effects of currency rate fluctuations, the Americas contributed 69%, EMEA contributed 28% and Asia Pacific contributed 3% to the growth in
our total revenues during fiscal 2015.
Excluding the effects of favorable currency variations of 3 percentage points, our total operating expenses increased during fiscal 2015 due to
expense increases across all of our lines of business, the largest of which were due to increased sales and marketing and research and
development expenses resulting primarily from increased headcount, increased cloud SaaS and PaaS expenses to support the increase in our
cloud SaaS and PaaS revenues, and increased acquisition related and other expenses.
Excluding the effects of unfavorable foreign currency rate fluctuations of 6 percentage points, our fiscal 2015 operating margin was flat in
comparison to the prior year, while our operating margin as a percentage of revenues decreased during fiscal 2015 as our total operating
expenses increased at a faster rate than our total revenues.
Fiscal 2014 Compared to Fiscal 2013 : On a constant currency basis, our total revenues increased in fiscal 2014 due to increases in our
software and cloud business revenues and our hardware systems business revenues, partially offset by a decrease in our services business
revenues. The constant currency revenue growth in our
55
Year Ended May 31,
Percent Change
Percent Change
(Dollars in millions)
2015
Actual
Constant
2014
Actual
Constant
2013
Total Revenues by Geography:
Americas
$
21,107
4%
6%
$
20,323
3%
4%
$
19,719
EMEA
11,380
-
5%
4%
11,946
7%
4%
11,158
Asia Pacific
5,739
-
4%
1%
6,006
-
5%
2%
6,303
Total revenues
38,226
0%
4%
38,275
3%
4%
37,180
Total Operating Expenses
24,355
4%
7%
23,516
5%
6%
22,496
Total Operating Margin
$
13,871
-
6%
0%
$
14,759
1%
1%
$
14,684
Total Operating Margin %
36%
39%
39%
% Revenues by Geography:
Americas
55%
53%
53%
EMEA
30%
31%
30%
Asia Pacific
15%
16%
17%
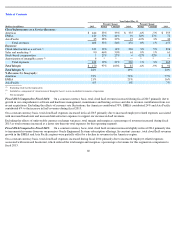
Total Revenues by Business:
Software and Cloud
$
29,475
1%
5%
$
29,199
5%
5%
$
27,920
Hardware Systems
5,205
-
3%
2%
5,372
0%
2%
5,346
Services
3,546
-
4%
0%
3,704
-
5%
-
4%
3,914
Total revenues
$
38,226
0%
4%
$
38,275
3%
4%
$
37,180
% Revenues by Business:
Software and Cloud
77%
76%
75%
Hardware Systems
14%
14%
14%
Services
9%
10%
11%
Comprised of Europe, the Middle East and Africa
Asia Pacific includes Japan
(1)
(2)
(1)
(2)