Oracle 2014 Annual Report Download - page 69
Download and view the complete annual report
Please find page 69 of the 2014 Oracle annual report below. You can navigate through the pages in the report by either clicking on the pages listed below, or by using the keyword search tool below to find specific information within the annual report.-
 1
1 -
2
-
3
-
4
-
5
-
6
-
7
-
8
-
9
-
10
-
11
-
12
-
13
-
14
-
15
-
16
-
17
-
18
-
19
-
20
-
21
-
22
-
23
-
24
-
25
-
26
-
27
-
28
-
29
-
30
-
31
-
32
-
33
-
34
-
35
-
36
-
37
-
38
-
39
-
40
-
41
-
42
-
43
-
44
-
45
-
46
-
47
-
48
-
49
-
50
-
51
-
52
-
53
-
54
-
55
-
56
-
57
-
58
-
 59
59 -
 60
60 -
 61
61 -
 62
62 -
 63
63 -
 64
64 -
 65
65 -
 66
66 -
 67
67 -
 68
68 -
 69
69 -
 70
70 -
 71
71 -
 72
72 -
 73
73 -
 74
74 -
 75
75 -
 76
76 -
 77
77 -
 78
78 -
 79
79 -
80
-
81
-
82
-
83
-
84
-
85
-
86
-
87
-
88
-
89
-
90
-
91
-
92
-
93
-
94
-
95
-
96
-
97
-
98
-
99
-
100
-
101
-
102
-
103
-
104
-
105
-
106
-
107
-
108
-
109
-
110
-
111
-
112
-
113
-
114
-
115
-
116
-
117
-
118
-
119
-
120
-
121
-
122
-
123
-
124
-
125
-
126
-
127
-
128
-
129
-
130
-
131
-
132
-
133
-
134
-
135
-
136
-
137
-
138
-
139
-
140
-
141
-
142
-
143
-
144
-
145
-
146
-
147
-
148
-
149
-
150
-
151
-
152
-
153
-
154
-
155
-
156
-
157
-
158
-
159
-
160
-
161
-
162
-
163
-
164
-
165
 |
 |
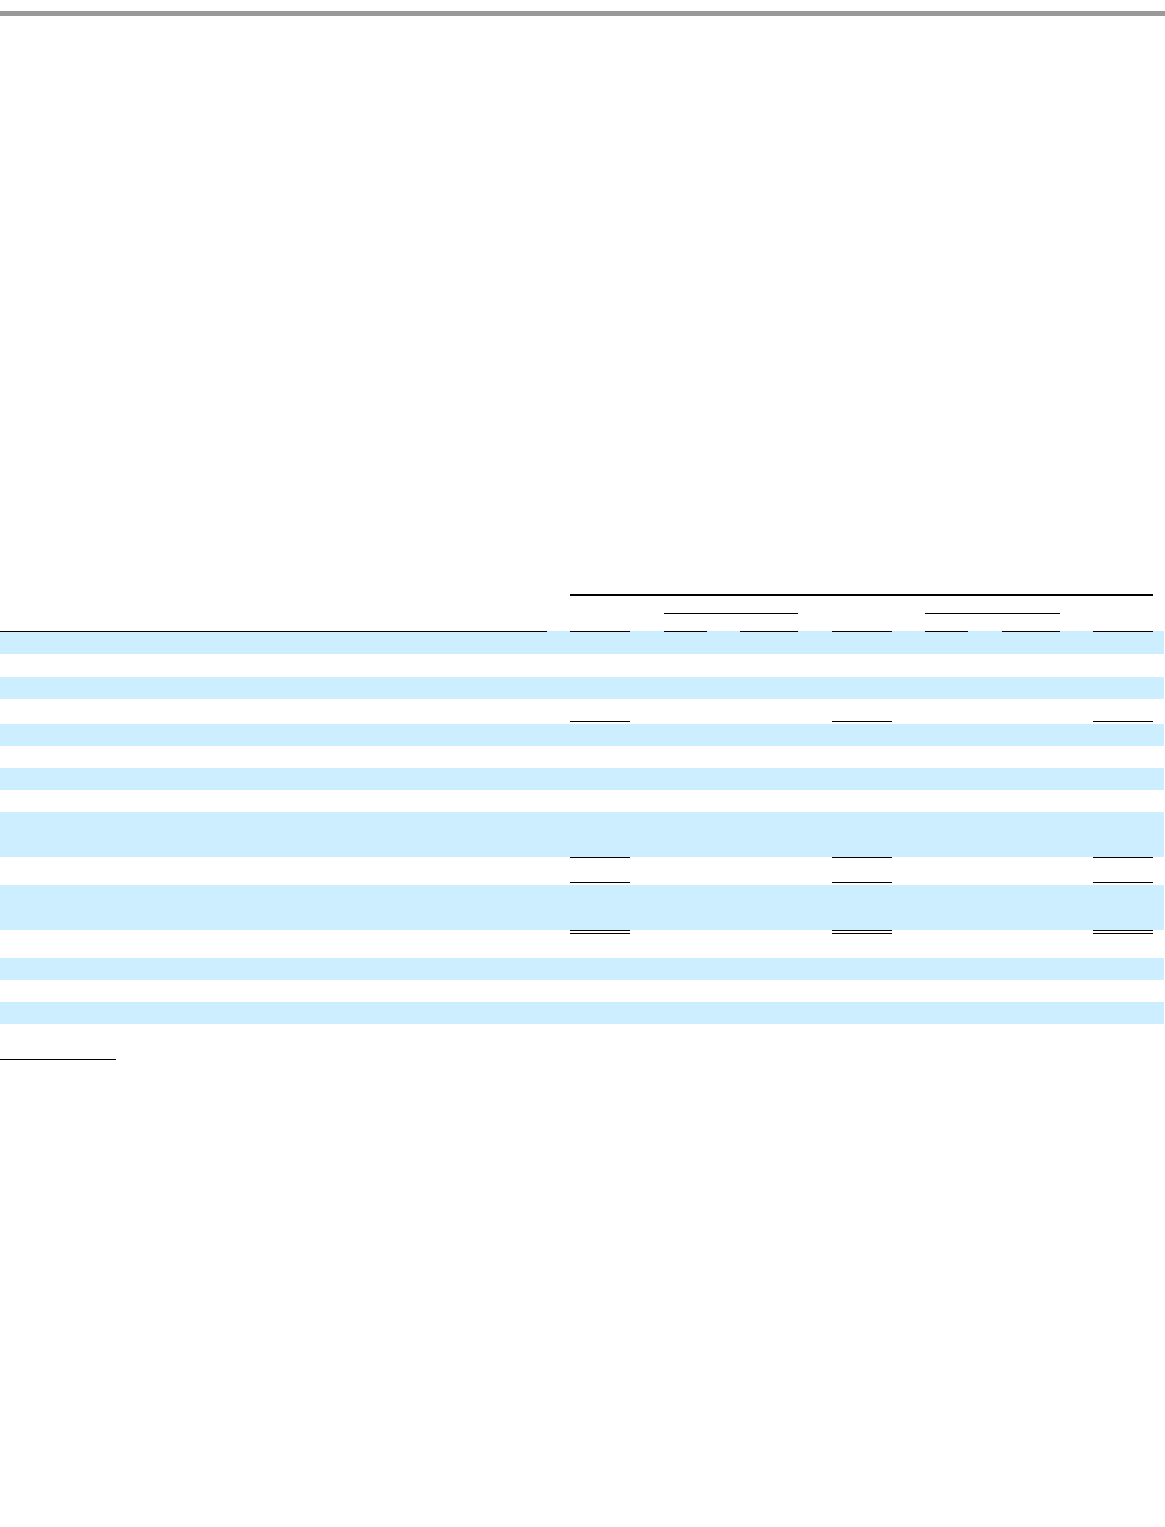
Table of Contents
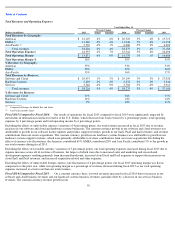
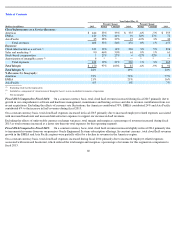
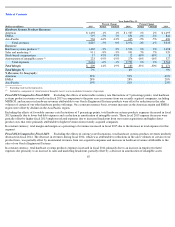
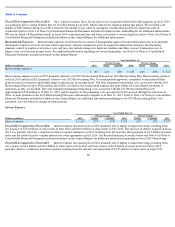
Fiscal 2014 Compared to Fiscal 2013: Excluding the impacts of unfavorable currency rate fluctuations, hardware systems support revenues
increased in fiscal 2014 primarily due to incremental revenues from our acquisitions. In constant currency, hardware systems support revenues
growth in the Americas and Asia Pacific region was partially offset by a decline in revenues in the EMEA region.
As described above, the amounts of hardware systems support revenues that we recognized in fiscal 2014 and fiscal 2013 were affected by
business combination accounting rules.
In constant currency, total hardware systems support expenses decreased in fiscal 2014 primarily due to a reduction in employee related
expenses attributable to operational initiatives including decreased headcount and reduced service delivery costs, partially offset by an increase
in amortization of intangible assets.
Excluding the effects of currency rate fluctuations, total hardware systems support margin and margin as a percentage of total revenues increased
in fiscal 2014 as our total revenues for this segment increased while our total expenses for this segment decreased.
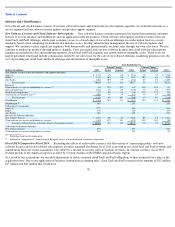
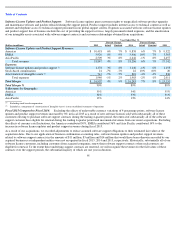
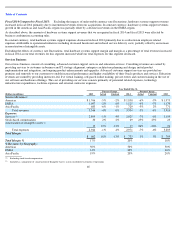
Services Business
Our services business consists of consulting, advanced customer support services and education services. Consulting revenues are earned by
providing services to customers in business and IT strategy alignment, enterprise architecture planning and design, initial product
implementation and integration, and ongoing product enhancements and upgrades. Advanced customer support services are provided on-
premises and remotely to our customers to enable increased performance and higher availability of their Oracle products and services. Education
revenues are earned by providing instructor-led, live virtual training, self-paced online training, private events and custom training in the use of
our software and hardware offerings. The cost of providing our services consists primarily of personnel related expenses, technology
infrastructure expenditures, facilities expenses and external contractor expenses.
65
Year Ended May 31,
Percent Change
Percent Change
(Dollars in millions)
2015
Actual
Constant
2014
Actual
Constant
2013
Services Revenues:
Americas
$
1,766
-
5%
-
2%
$
1,850
-
6%
-
5%
$
1,973
EMEA
1,097
-
2%
6%
1,125
-
4%
-
7%
1,170
Asia Pacific
683
-
6%
-
1%
729
-
5%
2%
771
Total revenues
3,546
-
4%
0%
3,704
-
5%
-
4%
3,914
Expenses:
Services
2,899
-
1%
4%
2,925
-
7%
-
6%
3,159
Stock
-
based compensation
30
2%
2%
29
25%
25%
23
Amortization of intangible assets
15
-
12%
-
12%
17
-
26%
-
26%
23
Total expenses
2,944
-
1%
4%
2,971
-
7%
-
6%
3,205
Total Margin
$
602
-
18%
-
13%
$
733
3%
5%
$
709
Total Margin %
17%
20%
18%
% Revenues by Geography:
Americas
50%
50%
50%
EMEA
31%
30%
30%
Asia Pacific
19%
20%
20%
Excluding stock
-
based compensation
Included as a component of
‘
Amortization of Intangible Assets
’
in our consolidated statements of operations
(1)
(2)
(1)
(2)