Oracle 2014 Annual Report Download - page 64
Download and view the complete annual report
Please find page 64 of the 2014 Oracle annual report below. You can navigate through the pages in the report by either clicking on the pages listed below, or by using the keyword search tool below to find specific information within the annual report.-
 1
1 -
2
-
3
-
4
-
5
-
6
-
7
-
8
-
9
-
10
-
11
-
12
-
13
-
14
-
15
-
16
-
17
-
18
-
19
-
20
-
21
-
22
-
23
-
24
-
25
-
26
-
27
-
28
-
29
-
30
-
31
-
32
-
33
-
34
-
35
-
36
-
37
-
38
-
39
-
40
-
41
-
42
-
43
-
44
-
45
-
46
-
47
-
48
-
49
-
50
-
51
-
52
-
53
-
 54
54 -
 55
55 -
 56
56 -
 57
57 -
 58
58 -
 59
59 -
 60
60 -
 61
61 -
 62
62 -
 63
63 -
 64
64 -
 65
65 -
 66
66 -
 67
67 -
 68
68 -
 69
69 -
 70
70 -
 71
71 -
 72
72 -
 73
73 -
 74
74 -
75
-
76
-
77
-
78
-
79
-
80
-
81
-
82
-
83
-
84
-
85
-
86
-
87
-
88
-
89
-
90
-
91
-
92
-
93
-
94
-
95
-
96
-
97
-
98
-
99
-
100
-
101
-
102
-
103
-
104
-
105
-
106
-
107
-
108
-
109
-
110
-
111
-
112
-
113
-
114
-
115
-
116
-
117
-
118
-
119
-
120
-
121
-
122
-
123
-
124
-
125
-
126
-
127
-
128
-
129
-
130
-
131
-
132
-
133
-
134
-
135
-
136
-
137
-
138
-
139
-
140
-
141
-
142
-
143
-
144
-
145
-
146
-
147
-
148
-
149
-
150
-
151
-
152
-
153
-
154
-
155
-
156
-
157
-
158
-
159
-
160
-
161
-
162
-
163
-
164
-
165
 |
 |
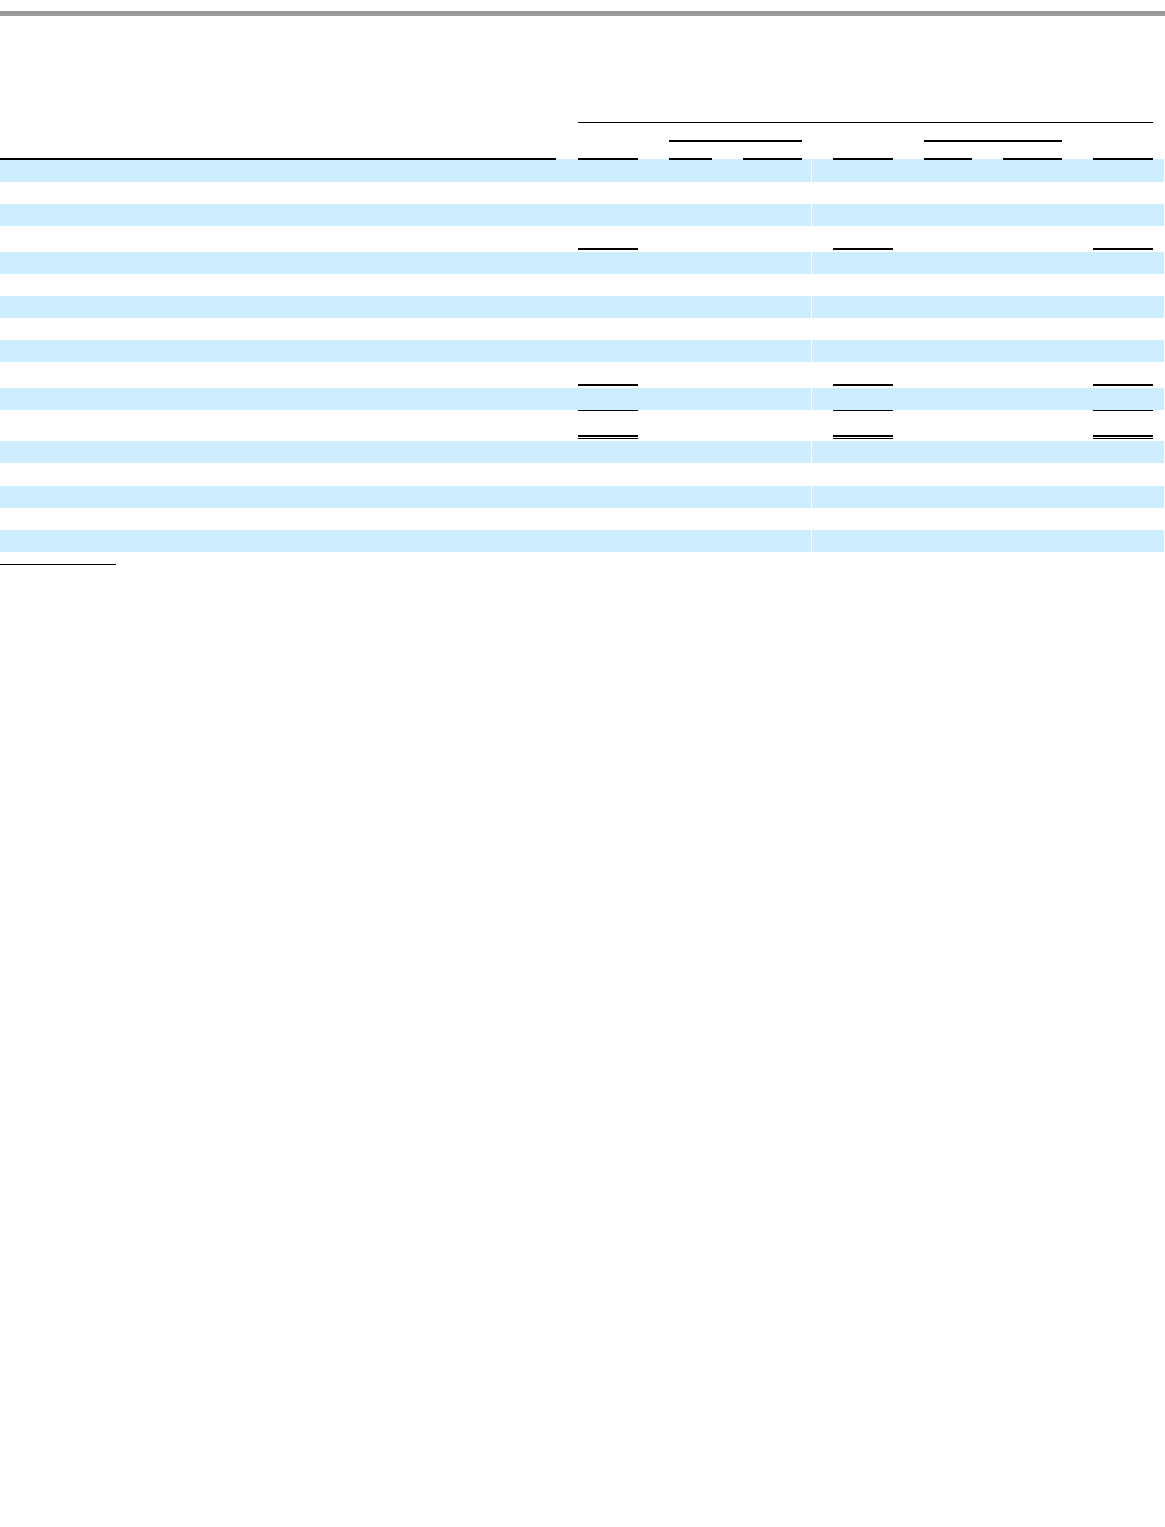
Table of Contents
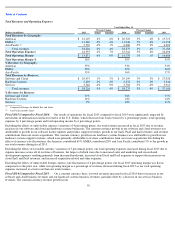
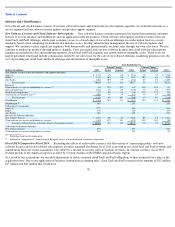
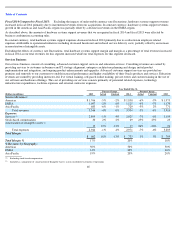
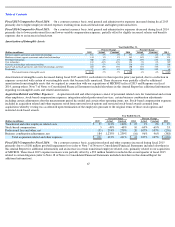
Fiscal 2015 Compared to Fiscal 2014: On a constant currency basis, total cloud IaaS revenues increased during fiscal 2015 primarily due to
growth in our comprehensive software and hardware management, maintenance and hosting services and due to revenue contributions from our
recent acquisitions. Excluding the effects of currency rate fluctuations, the Americas contributed 70%, EMEA contributed 24% and Asia Pacific
contributed 6% to the increase in IaaS revenues during fiscal 2015.
On a constant currency basis, total cloud IaaS expenses increased in fiscal 2015 primarily due to increased employee related expenses associated
with increased headcount and increased infrastructure expenses to support our increase in IaaS revenues.
Excluding the effects of unfavorable currency exchange variances, total margin and margin as a percentage of revenues increased during fiscal
2015 as total revenues increased at a faster rate than our total expenses for this operating segment.
Fiscal 2014 Compared to Fiscal 2013: On a constant currency basis, total cloud IaaS revenues increased slightly in fiscal 2014 primarily due
to incremental revenues from our on-
premises Oracle Engineered Systems subscription offerings. In constant currency, total cloud IaaS revenues
growth in the EMEA and Asia Pacific regions were partially offset by a decline in revenues in the Americas region.
On a constant currency basis, total cloud IaaS expenses increased during fiscal 2014 primarily due to increased employee related expenses
associated with increased headcount, which reduced the total margin and margin as a percentage of revenues for this segment in comparison to
fiscal 2013.
60
Year Ended May 31,
Percent Change
Percent Change
(Dollars in millions)
2015
Actual
Constant
2014
Actual
Constant
2013
Cloud Infastructure as a Service Revenues:
Americas
$
444
33%
35%
$
335
-
6%
-
5%
$
355
EMEA
129
37%
41%
94
32%
27%
72
Asia Pacific
35
28%
39%
27
-
12%
3%
30
Total revenues
608
33%
36%
456
0%
1%
457
Expenses:
Cloud infastructure as a service
339
12%
14%
304
3%
5%
296
Sales and marketing
90
46%
50%
61
0%
1%
61
Stock
-
based compensation
5
27%
27%
4
-
52%
-
52%
8
Amortization of intangible assets
4
*
*
—
*
*
—
Total expenses
438
19%
21%
369
1%
3%
365
Total Margin
$
170
97%
103%
$
87
-
6%
-
9%
$
92
Total Margin %
28%
19%
20%
% Revenues by Geography:
Americas
73%
73%
77%
EMEA
21%
21%
16%
Asia Pacific
6%
6%
7%
Excluding stock
-
based compensation
Included as a component of
‘
Amortization of Intangible Assets
’
in our consolidated statements of operations
Not meaningful
(1)
(1)
(2)
(1)
(2)
*