Oracle 2014 Annual Report Download - page 39
Download and view the complete annual report
Please find page 39 of the 2014 Oracle annual report below. You can navigate through the pages in the report by either clicking on the pages listed below, or by using the keyword search tool below to find specific information within the annual report.-
 1
1 -
2
-
3
-
4
-
5
-
6
-
7
-
8
-
9
-
10
-
11
-
12
-
13
-
14
-
15
-
16
-
17
-
18
-
19
-
20
-
21
-
22
-
23
-
24
-
25
-
26
-
27
-
28
-
 29
29 -
 30
30 -
 31
31 -
 32
32 -
 33
33 -
 34
34 -
 35
35 -
 36
36 -
 37
37 -
 38
38 -
 39
39 -
 40
40 -
 41
41 -
 42
42 -
 43
43 -
 44
44 -
 45
45 -
 46
46 -
 47
47 -
 48
48 -
 49
49 -
50
-
51
-
52
-
53
-
54
-
55
-
56
-
57
-
58
-
59
-
60
-
61
-
62
-
63
-
64
-
65
-
66
-
67
-
68
-
69
-
70
-
71
-
72
-
73
-
74
-
75
-
76
-
77
-
78
-
79
-
80
-
81
-
82
-
83
-
84
-
85
-
86
-
87
-
88
-
89
-
90
-
91
-
92
-
93
-
94
-
95
-
96
-
97
-
98
-
99
-
100
-
101
-
102
-
103
-
104
-
105
-
106
-
107
-
108
-
109
-
110
-
111
-
112
-
113
-
114
-
115
-
116
-
117
-
118
-
119
-
120
-
121
-
122
-
123
-
124
-
125
-
126
-
127
-
128
-
129
-
130
-
131
-
132
-
133
-
134
-
135
-
136
-
137
-
138
-
139
-
140
-
141
-
142
-
143
-
144
-
145
-
146
-
147
-
148
-
149
-
150
-
151
-
152
-
153
-
154
-
155
-
156
-
157
-
158
-
159
-
160
-
161
-
162
-
163
-
164
-
165
 |
 |
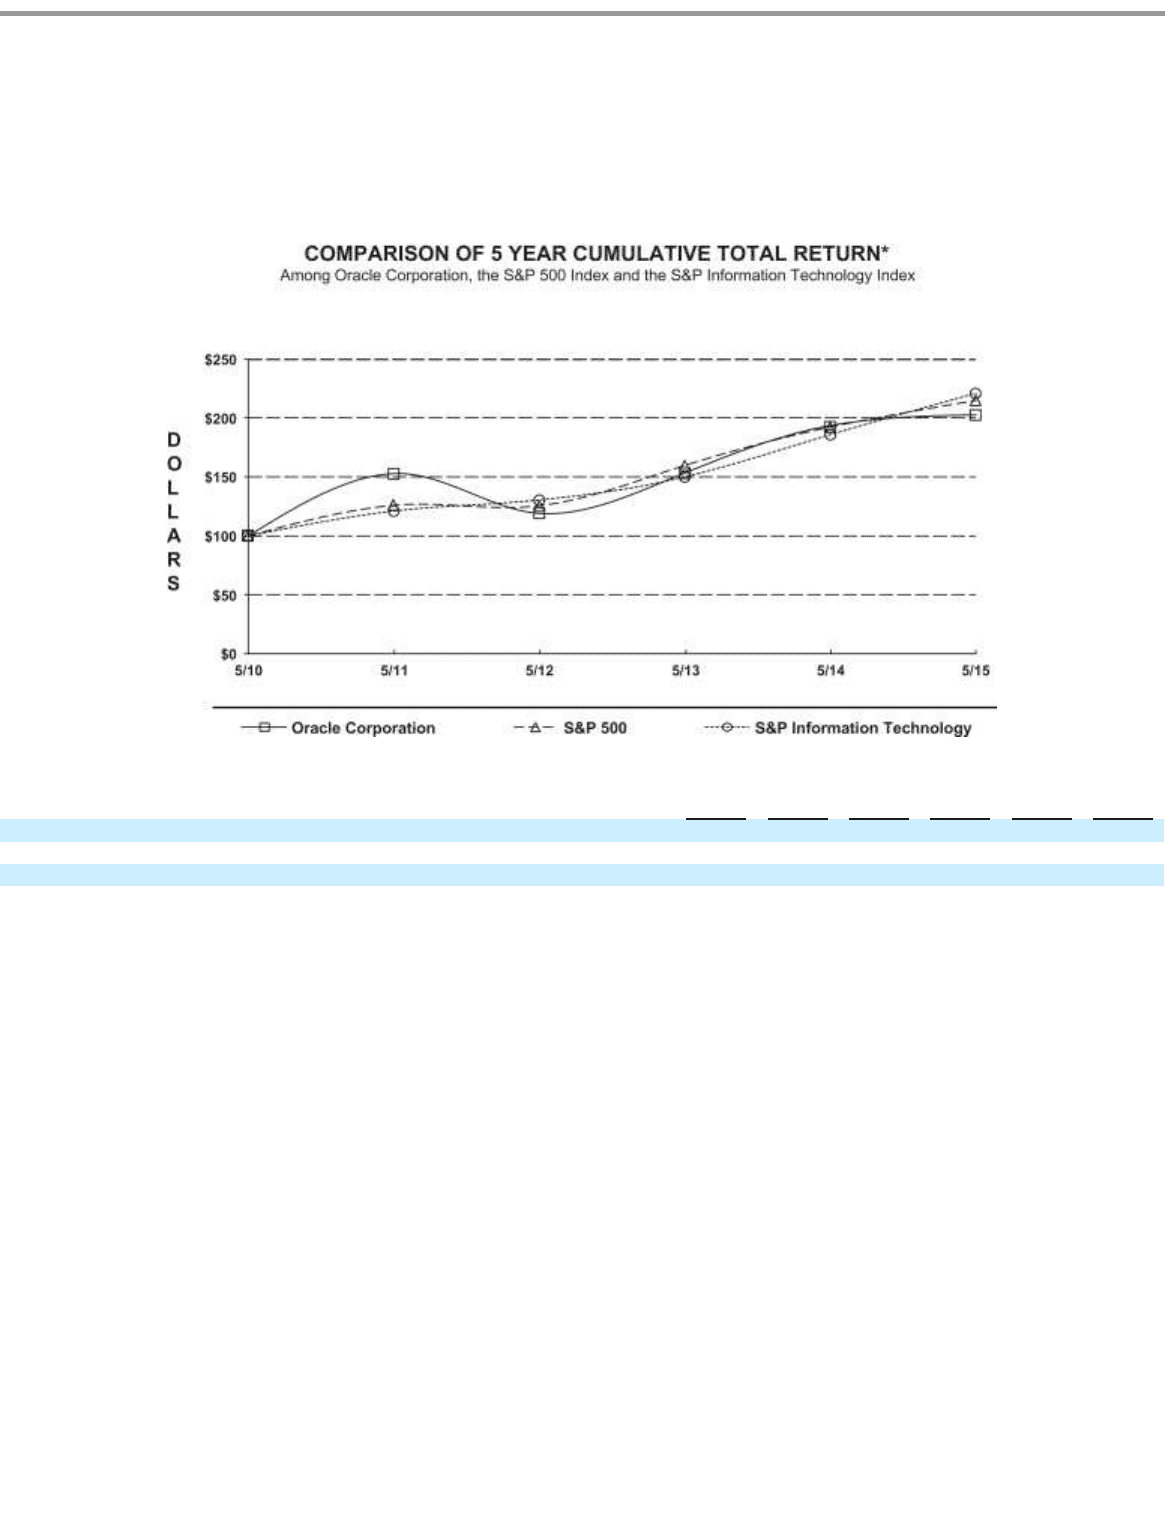
Table of Contents
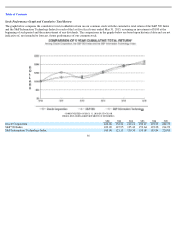
Stock Performance Graph and Cumulative Total Return
The graph below compares the cumulative total stockholder return on our common stock with the cumulative total return of the S&P 500 Index
and the S&P Information Technology Index for each of the last five fiscal years ended May 31, 2015, assuming an investment of $100 at the
beginning of such period and the reinvestment of any dividends. The comparisons in the graphs below are based upon historical data and are not
indicative of, nor intended to forecast, future performance of our common stock.
*$100 INVESTED ON MAY 31, 2010 IN STOCK OR
INDEX-INCLUDING REINVESTMENT OF DIVIDENDS
35
5/10
5/11
5/12
5/13
5/14
5/15
Oracle Corporation
100.00
152.74
119.11
153.47
193.53
202.77
S&P 500 Index
100.00
125.95
125.43
159.64
192.28
214.99
S&P Information Technology Index
100.00
121.13
130.30
150.00
185.84
220.80