Oracle 2014 Annual Report Download - page 68
Download and view the complete annual report
Please find page 68 of the 2014 Oracle annual report below. You can navigate through the pages in the report by either clicking on the pages listed below, or by using the keyword search tool below to find specific information within the annual report.-
 1
1 -
2
-
3
-
4
-
5
-
6
-
7
-
8
-
9
-
10
-
11
-
12
-
13
-
14
-
15
-
16
-
17
-
18
-
19
-
20
-
21
-
22
-
23
-
24
-
25
-
26
-
27
-
28
-
29
-
30
-
31
-
32
-
33
-
34
-
35
-
36
-
37
-
38
-
39
-
40
-
41
-
42
-
43
-
44
-
45
-
46
-
47
-
48
-
49
-
50
-
51
-
52
-
53
-
54
-
55
-
56
-
57
-
 58
58 -
 59
59 -
 60
60 -
 61
61 -
 62
62 -
 63
63 -
 64
64 -
 65
65 -
 66
66 -
 67
67 -
 68
68 -
 69
69 -
 70
70 -
 71
71 -
 72
72 -
 73
73 -
 74
74 -
 75
75 -
 76
76 -
 77
77 -
 78
78 -
79
-
80
-
81
-
82
-
83
-
84
-
85
-
86
-
87
-
88
-
89
-
90
-
91
-
92
-
93
-
94
-
95
-
96
-
97
-
98
-
99
-
100
-
101
-
102
-
103
-
104
-
105
-
106
-
107
-
108
-
109
-
110
-
111
-
112
-
113
-
114
-
115
-
116
-
117
-
118
-
119
-
120
-
121
-
122
-
123
-
124
-
125
-
126
-
127
-
128
-
129
-
130
-
131
-
132
-
133
-
134
-
135
-
136
-
137
-
138
-
139
-
140
-
141
-
142
-
143
-
144
-
145
-
146
-
147
-
148
-
149
-
150
-
151
-
152
-
153
-
154
-
155
-
156
-
157
-
158
-
159
-
160
-
161
-
162
-
163
-
164
-
165
 |
 |
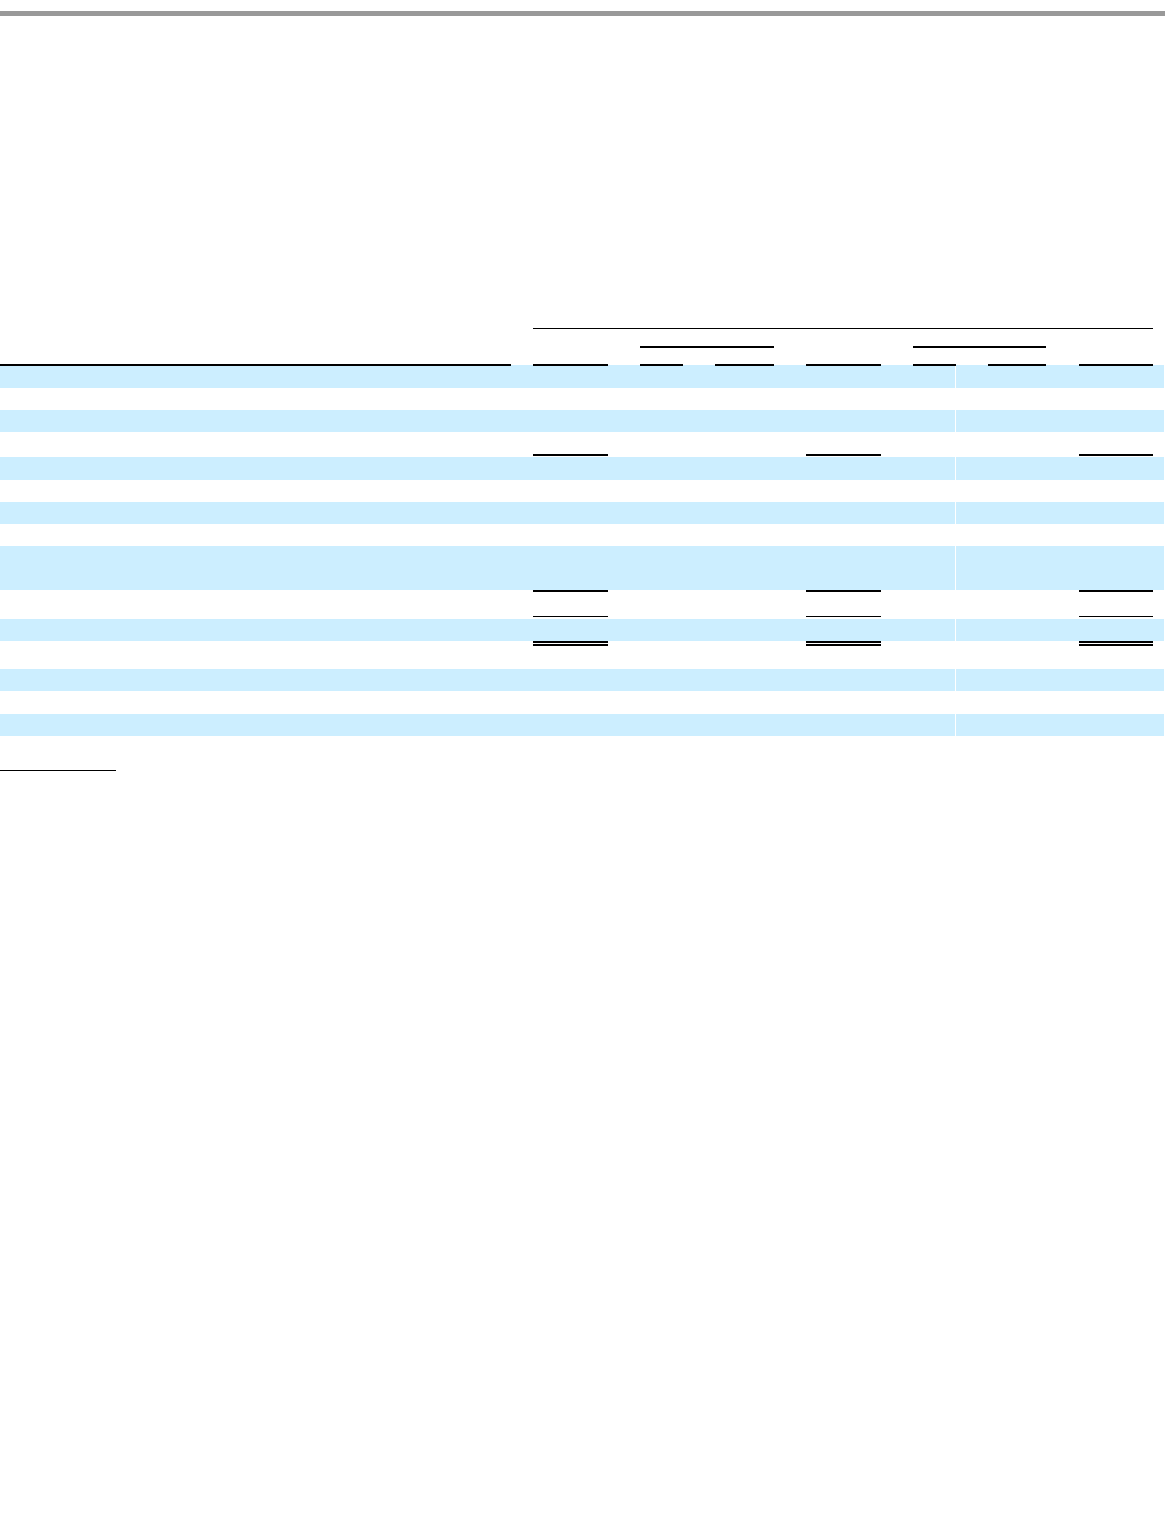
Table of Contents
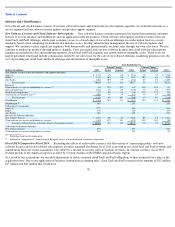
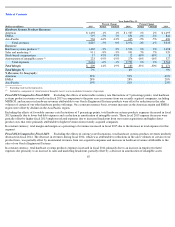
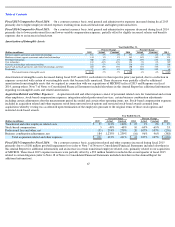
Excluding the effects of currency rate fluctuations, total margin and margin as a percentage of revenues decreased in fiscal 2014 due to a
decrease in our total revenues and increase in our total expenses for this segment.
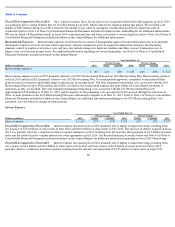
Hardware Systems Support:
Our hardware systems support offerings provide customers with software updates for software components that
are essential to the functionality of our hardware products, such as Oracle Solaris and certain other software products, and can include product
repairs, maintenance services and technical support services. Expenses associated with our hardware systems support operating segment include
the cost of materials used to repair customer products, the cost of providing support services, largely personnel related expenses, and the
amortization of our intangible assets primarily associated with hardware systems support contracts and customer relationships obtained from our
acquisitions.
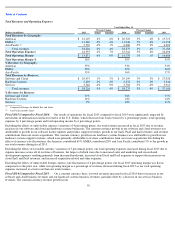
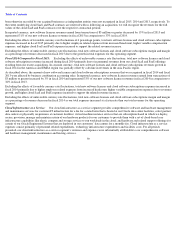
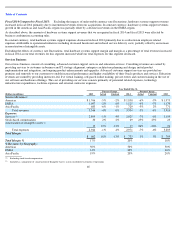
Fiscal 2015 Compared to Fiscal 2014: Excluding the effects of unfavorable currency rate fluctuations of 5 percentage points, hardware
systems support revenues increased in fiscal 2015 primarily due to incremental revenues from our recently acquired companies, including
MICROS. The Americas region contributed 42%, EMEA contributed 52% and Asia Pacific contributed 6%, to our constant currency growth in
hardware systems support revenues during fiscal 2015.
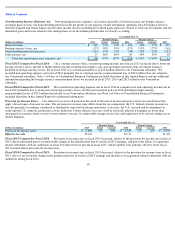
As a result of our acquisitions, we recorded adjustments to reduce assumed hardware systems support obligations to their estimated fair values at
the acquisition dates. Due to our application of business combination accounting rules, hardware systems support revenues related to hardware
systems support contracts in the amounts of $4 million, $11 million and $14 million were not recognized in fiscal 2015, 2014 and 2013,
respectively. To the extent these underlying hardware systems support contracts are renewed, we will recognize the revenues for the full values
of these contracts over the future support periods.
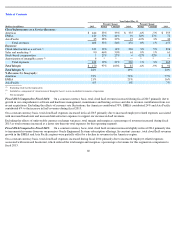
In constant currency, total hardware systems support expenses decreased in fiscal 2015 primarily due to reduced service delivery costs due to
operational initiatives and a decrease in amortization of intangible assets, partially offset by higher employee related expenses resulting from
increased headcount from our recent acquisitions, higher external contractor expenses and higher bad debt expenses.
In constant currency, total hardware systems support margin and margin as a percentage of total revenues increased in fiscal 2015 due to the
increase in total revenues and decrease in total expenses for this operating segment.
64
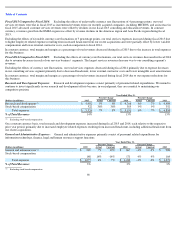
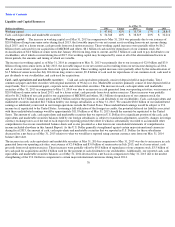
Year Ended May 31,
Percent Change
Percent Change
(Dollars in millions)
2015
Actual
Constant
2014
Actual
Constant
2013
Hardware Systems Support Revenues:
Americas
$
1,245
1%
3%
$
1,229
11%
12%
$
1,109
EMEA
722
-
2%
6%
738
-
2%
-
4%
752
Asia Pacific
413
-
4%
1%
429
-
5%
2%
452
Total revenues
2,380
-
1%
4%
2,396
4%
5%
2,313
Expenses:
Hardware systems support
810
-
2%
2%
830
-
6%
-
5%
885
Stock
-
based compensation
6
3%
3%
6
26%
26%
5
Amortization of intangible assets
158
-
32%
-
32%
231
8%
8%
213
Total expenses
974
-
9%
-
6%
1,067
-
3%
-
3%
1,103
Total Margin
$
1,406
6%
11%
$
1,329
10%
12%
$
1,210
Total Margin %
59%
55%
52%
% Revenues by Geography:
Americas
52%
51%
48%
EMEA
30%
31%
32%
Asia Pacific
18%
18%
20%
Excluding stock
-
based compensation
Included as a component of
‘
Amortization of Intangible Assets
’
in our consolidated statements of operations
(1)
(2)
(1)
(2)