Oracle 2014 Annual Report Download - page 81
Download and view the complete annual report
Please find page 81 of the 2014 Oracle annual report below. You can navigate through the pages in the report by either clicking on the pages listed below, or by using the keyword search tool below to find specific information within the annual report.-
 1
1 -
2
-
3
-
4
-
5
-
6
-
7
-
8
-
9
-
10
-
11
-
12
-
13
-
14
-
15
-
16
-
17
-
18
-
19
-
20
-
21
-
22
-
23
-
24
-
25
-
26
-
27
-
28
-
29
-
30
-
31
-
32
-
33
-
34
-
35
-
36
-
37
-
38
-
39
-
40
-
41
-
42
-
43
-
44
-
45
-
46
-
47
-
48
-
49
-
50
-
51
-
52
-
53
-
54
-
55
-
56
-
57
-
58
-
59
-
60
-
61
-
62
-
63
-
64
-
65
-
66
-
67
-
68
-
69
-
70
-
 71
71 -
 72
72 -
 73
73 -
 74
74 -
 75
75 -
 76
76 -
 77
77 -
 78
78 -
 79
79 -
 80
80 -
 81
81 -
 82
82 -
 83
83 -
 84
84 -
 85
85 -
 86
86 -
 87
87 -
 88
88 -
 89
89 -
 90
90 -
 91
91 -
92
-
93
-
94
-
95
-
96
-
97
-
98
-
99
-
100
-
101
-
102
-
103
-
104
-
105
-
106
-
107
-
108
-
109
-
110
-
111
-
112
-
113
-
114
-
115
-
116
-
117
-
118
-
119
-
120
-
121
-
122
-
123
-
124
-
125
-
126
-
127
-
128
-
129
-
130
-
131
-
132
-
133
-
134
-
135
-
136
-
137
-
138
-
139
-
140
-
141
-
142
-
143
-
144
-
145
-
146
-
147
-
148
-
149
-
150
-
151
-
152
-
153
-
154
-
155
-
156
-
157
-
158
-
159
-
160
-
161
-
162
-
163
-
164
-
165
 |
 |
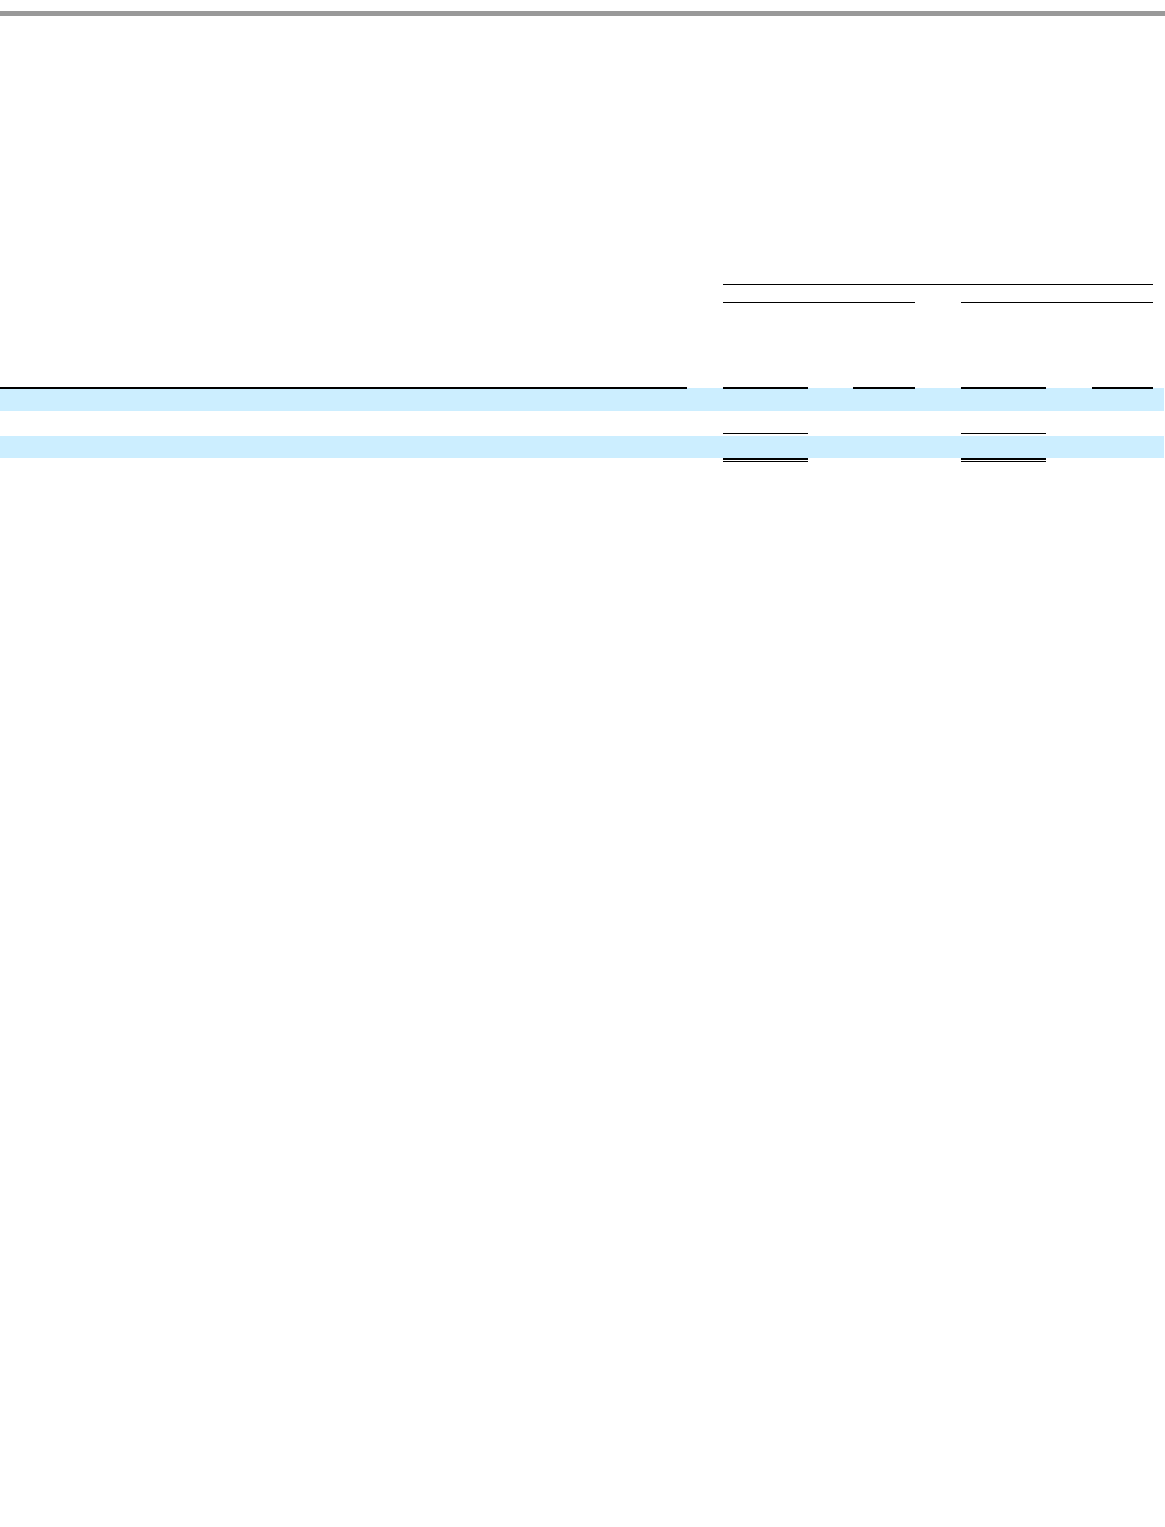
Table of Contents
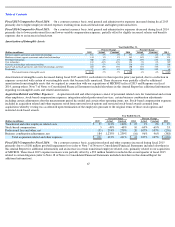
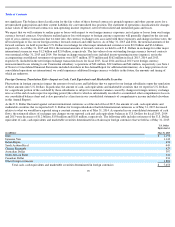
values of our marketable securities holdings by $191 million. Substantially all of our marketable securities are designated as available-for-sale.
We generally do not use our investments for trading purposes.
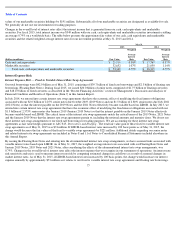
Changes in the overall level of interest rates affect the interest income that is generated from our cash, cash equivalents and marketable
securities. For fiscal 2015, total interest income was $349 million with our cash, cash equivalents and marketable securities investments yielding
an average 0.79% on a worldwide basis. The table below presents the approximate fair values of our cash, cash equivalents and marketable
securities and the related weighted average interest rates for our investment portfolio at May 31, 2015 and 2014.
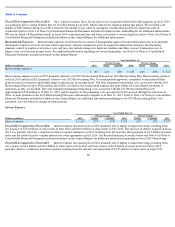
Interest Expense Risk
Interest Expense Risk
— Fixed to Variable Interest Rate Swap Agreements
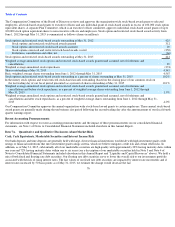
Our total borrowings were $42.0 billion as of May 31, 2015, consisting of $39.7 billion of fixed rate borrowings and $2.3 billion of floating rate
borrowings (Floating Rate Notes). During fiscal 2015, we issued $20.0 billion of senior notes comprised of $1.75 billion of floating rate notes
and $18.25 billion of fixed rate notes as described in the “Recent Financing Activities” section of Management’s Discussion and Analysis of
Financial Condition and Results of Operations (Item 7) in this Annual Report.
In July 2014, we entered into certain interest rate swap agreements that have the economic effect of modifying the fixed interest obligations
associated with our $2.0 billion of 2.25% senior notes due October 2019 (2019 Notes) and our $1.5 billion of 2.80% senior notes due July 2021
(2021 Notes) so that the interest payable on the 2019 Notes and the 2021 Notes effectively became variable based on LIBOR. In July 2013, we
entered into certain interest rate swap agreements that have the economic effect of modifying the fixed interest obligations associated with our
$1.5 billion of 2.375% senior notes due January 2019 (January 2019 Notes) so that the interest payable on the January 2019 Notes effectively
became variable based on LIBOR. The critical terms of the interest rate swap agreements match the critical terms of the 2019 Notes, 2021 Notes
and the January 2019 Notes that the interest rate swap agreements pertain to, including the notional amounts and maturity dates. We do not use
these interest rate swap arrangements or our fixed rate borrowings for trading purposes. We are accounting for these interest rate swap
agreements as fair value hedges pursuant to ASC 815, Derivatives and Hedging . The total fair value gain of these fixed to variable interest rate
swap agreements as of May 31, 2015 was $74 million. If LIBOR-based interest rates increased by 100 basis points as of May 31, 2015, the
change would decrease the fair values of the fixed to variable swap agreements by $221 million. Additional details regarding our senior notes
and related interest rate swap agreements are included in Notes 8 and 11 of Notes to Consolidated Financial Statements included elsewhere in
this Annual Report.
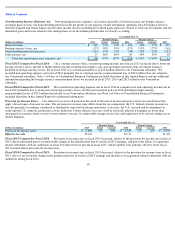
By issuing the Floating Rate Notes and entering into the aforementioned interest rate swap arrangements, we have assumed risks associated with
variable interest rates based upon LIBOR. As of May 31, 2015, the weighted average interest rate associated with our Floating Rate Notes and
January 2019 Notes, 2019 Notes and 2021 Notes, after considering the effects of the aforementioned interest rate swap arrangements, was
0.79%. Changes in the overall level of interest rates affect the interest expense that we recognize in our statements of operations. An interest rate
risk sensitivity analysis is used to measure interest rate risk by computing estimated changes in cash flows as a result of assumed changes in
market interest rates. As of May 31, 2015, if LIBOR-based interest rates increased by 100 basis points, the change would increase our interest
expense annually by approximately $73 million as it relates to our fixed to variable interest rate swap agreements and floating rate borrowings.
77
May 31,
2015
2014
(Dollars in millions)
Fair Value
Weighted
Average
Interest
Rate
Fair Value
Weighted
Average
Interest
Rate
Cash and cash equivalents
$
21,716
0.36%
$
17,769
0.37%
Marketable securities
32,652
1.07%
21,050
1.14%
Total cash, cash equivalents and marketable securities
$
54,368
0.79%
$
38,819
0.79%