Oracle 2014 Annual Report Download - page 76
Download and view the complete annual report
Please find page 76 of the 2014 Oracle annual report below. You can navigate through the pages in the report by either clicking on the pages listed below, or by using the keyword search tool below to find specific information within the annual report.-
 1
1 -
2
-
3
-
4
-
5
-
6
-
7
-
8
-
9
-
10
-
11
-
12
-
13
-
14
-
15
-
16
-
17
-
18
-
19
-
20
-
21
-
22
-
23
-
24
-
25
-
26
-
27
-
28
-
29
-
30
-
31
-
32
-
33
-
34
-
35
-
36
-
37
-
38
-
39
-
40
-
41
-
42
-
43
-
44
-
45
-
46
-
47
-
48
-
49
-
50
-
51
-
52
-
53
-
54
-
55
-
56
-
57
-
58
-
59
-
60
-
61
-
62
-
63
-
64
-
65
-
 66
66 -
 67
67 -
 68
68 -
 69
69 -
 70
70 -
 71
71 -
 72
72 -
 73
73 -
 74
74 -
 75
75 -
 76
76 -
 77
77 -
 78
78 -
 79
79 -
 80
80 -
 81
81 -
 82
82 -
 83
83 -
 84
84 -
 85
85 -
 86
86 -
87
-
88
-
89
-
90
-
91
-
92
-
93
-
94
-
95
-
96
-
97
-
98
-
99
-
100
-
101
-
102
-
103
-
104
-
105
-
106
-
107
-
108
-
109
-
110
-
111
-
112
-
113
-
114
-
115
-
116
-
117
-
118
-
119
-
120
-
121
-
122
-
123
-
124
-
125
-
126
-
127
-
128
-
129
-
130
-
131
-
132
-
133
-
134
-
135
-
136
-
137
-
138
-
139
-
140
-
141
-
142
-
143
-
144
-
145
-
146
-
147
-
148
-
149
-
150
-
151
-
152
-
153
-
154
-
155
-
156
-
157
-
158
-
159
-
160
-
161
-
162
-
163
-
164
-
165
 |
 |

Table of Contents
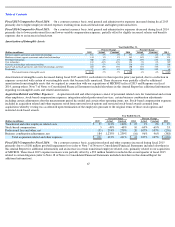
2014 in comparison to $5.0 billion of senior notes issued during fiscal 2013), lower stock repurchase activity during fiscal 2014 and higher
proceeds from stock option exercises during fiscal 2014. These fiscal 2014 cash favorable variances were partially offset by an increase in
payments of cash dividends to stockholders in fiscal 2014 in comparison to fiscal 2013.
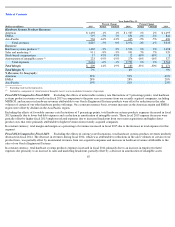
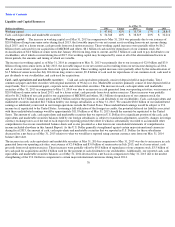
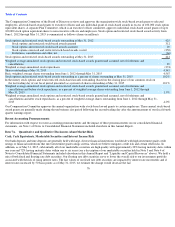
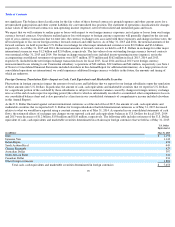
Free cash flow: To supplement our statements of cash flows presented on a GAAP basis, we use non-GAAP measures of cash flows on a
trailing 4-quarter basis to analyze cash flows generated from our operations. We believe free cash flow is also useful as one of the bases for
comparing our performance with our competitors. The presentation of non-GAAP free cash flow is not meant to be considered in isolation or as
an alternative to net income as an indicator of our performance, or as an alternative to cash flows from operating activities as a measure of
liquidity. We calculate free cash flows as follows:
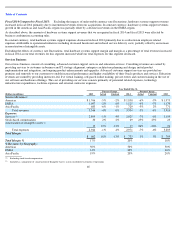
Long
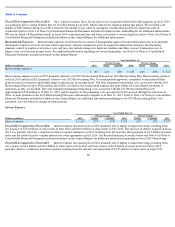
-Term Customer Financing: We offer certain of our customers the option to acquire our software products, hardware systems products
and services offerings through separate long-term payment contracts. We generally sell these contracts that we have financed for our customers
on a non-recourse basis to financial institutions within 90 days of the contracts’ dates of execution. We record the transfers of amounts due from
customers to financial institutions as sales of financial assets because we are considered to have surrendered control of these financial assets. We
financed $1.6 billion in each of fiscal 2015 and 2014, and $1.8 billion in fiscal 2013, or approximately 19%, 17% and 19%, respectively, of our
new software licenses revenues in fiscal 2015, 2014 and 2013. We financed $172 million, $168 million and $161 million of our hardware
systems products revenues in fiscal 2015, 2014 and 2013, respectively, or approximately 6% in each of fiscal 2015 and 2014 and 5% in fiscal
2013 of our hardware systems products revenues.
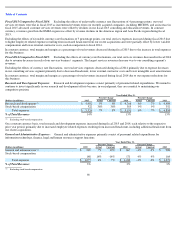
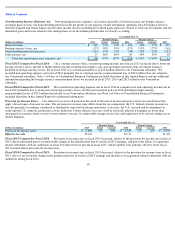
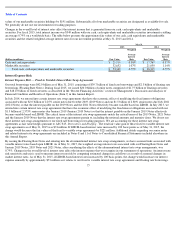
Recent Financing Activities:
Senior Notes : As of May 31, 2015, we had $42.0 billion of senior notes outstanding ($24.1 billion outstanding as of May 31, 2014). In fiscal
2015, we issued $20.0 billion of senior notes comprised of $1.0 billion of floating rate notes due July 2017 (2017 Notes), $750 million of
floating rate notes due October 2019 (2019 Floating Rate Notes), $2.0 billion of 2.25% notes due October 2019 (2019 Notes), $1.5 billion of
2.80% notes due July 2021 (2021 Notes), $2.5 billion of 2.50% notes due May 2022 (2022 Notes), $2.0 billion of 3.40% notes due July 2024
(2024 Notes), $2.5 billion of 2.95% notes due May 2025 (2025 Notes), $500 million of 3.25% notes due May 2030 (2030 Notes), $1.75 billion
of 4.30% notes due July 2034 (2034 Notes), $1.25 billion of 3.90% notes due May 2035 (2035 Notes), $1.0 billion of 4.50% notes due July 2044
(2044 Notes), $2.0 billion of 4.125% notes due May 2045 (2045 Notes) and $1.25 billion of 4.375% notes due May 2055 (2055 Notes, and
together with the 2017 Notes, 2019 Floating Rate Notes, 2019 Notes, 2021 Notes, 2022 Notes, 2024 Notes, 2025 Notes, 2030 Notes, 2034
Notes, 2035 Notes, 2044 Notes and 2045 Notes, the Senior Notes).
We issued the Senior Notes for general corporate purposes, which may include stock repurchases, payment of cash dividends on our common
stock, future acquisitions and repayment of indebtedness. Additional details regarding our Senior Notes and related interest rate swap agreements
are included in Notes 8 and 11 of Notes to Consolidated Financial Statements included elsewhere in this Annual Report.
In July 2014, our 3.75% senior notes due July 2014 for $1.5 billion matured and were repaid, and we settled the fixed to variable interest rate
swap agreements associated with such fixed rate senior notes.
72
Year Ended May 31,
(Dollars in millions)
2015
Change
2014
Change
2013
Net cash provided by operating activities
$
14,336
-
4%
$
14,921
5%
$
14,224
Capital expenditures
(1,391
)
140%
(580
)
-
11%
(650
)
Free cash flow
$
12,945
-
10%
$
14,341
6%
$
13,574
Net income
$
9,938
$
10,955
$
10,925
Free cash flow as percent of net income
130%
131%
124%
Derived from capital expenditures as reported in cash flows from investing activities as per our consolidated statements of cash flows presented in accordance with U.S. GAAP.
(1)
(1)