Oracle 2014 Annual Report Download - page 40
Download and view the complete annual report
Please find page 40 of the 2014 Oracle annual report below. You can navigate through the pages in the report by either clicking on the pages listed below, or by using the keyword search tool below to find specific information within the annual report.-
 1
1 -
2
-
3
-
4
-
5
-
6
-
7
-
8
-
9
-
10
-
11
-
12
-
13
-
14
-
15
-
16
-
17
-
18
-
19
-
20
-
21
-
22
-
23
-
24
-
25
-
26
-
27
-
28
-
29
-
 30
30 -
 31
31 -
 32
32 -
 33
33 -
 34
34 -
 35
35 -
 36
36 -
 37
37 -
 38
38 -
 39
39 -
 40
40 -
 41
41 -
 42
42 -
 43
43 -
 44
44 -
 45
45 -
 46
46 -
 47
47 -
 48
48 -
 49
49 -
 50
50 -
51
-
52
-
53
-
54
-
55
-
56
-
57
-
58
-
59
-
60
-
61
-
62
-
63
-
64
-
65
-
66
-
67
-
68
-
69
-
70
-
71
-
72
-
73
-
74
-
75
-
76
-
77
-
78
-
79
-
80
-
81
-
82
-
83
-
84
-
85
-
86
-
87
-
88
-
89
-
90
-
91
-
92
-
93
-
94
-
95
-
96
-
97
-
98
-
99
-
100
-
101
-
102
-
103
-
104
-
105
-
106
-
107
-
108
-
109
-
110
-
111
-
112
-
113
-
114
-
115
-
116
-
117
-
118
-
119
-
120
-
121
-
122
-
123
-
124
-
125
-
126
-
127
-
128
-
129
-
130
-
131
-
132
-
133
-
134
-
135
-
136
-
137
-
138
-
139
-
140
-
141
-
142
-
143
-
144
-
145
-
146
-
147
-
148
-
149
-
150
-
151
-
152
-
153
-
154
-
155
-
156
-
157
-
158
-
159
-
160
-
161
-
162
-
163
-
164
-
165
 |
 |

Table of Contents
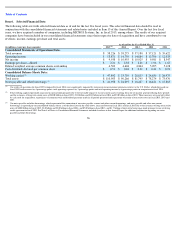
Item 6. Selected Financial Data
The following table sets forth selected financial data as of and for the last five fiscal years. This selected financial data should be read in
conjunction with the consolidated financial statements and related notes included in Item 15 of this Annual Report. Over the last five fiscal
years, we have acquired a number of companies, including MICROS Systems, Inc. in fiscal 2015, among others. The results of our acquired
companies have been included in our consolidated financial statements since their respective dates of acquisition and have contributed to our
revenues, income, earnings per share and total assets.
36
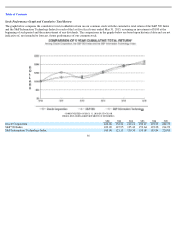
As of and for the Year Ended May 31,
(in millions, except per share amounts)
2015
2014
2013
2012
2011
Consolidated Statements of Operations Data:
Total revenues
$
38,226
$
38,275
$
37,180
$
37,121
$
35,622
Operating income
$
13,871
$
14,759
$
14,684
$
13,706
$
12,033
Net income
$
9,938
$
10,955
$
10,925
$
9,981
$
8,547
Earnings per share
—
diluted
$
2.21
$
2.38
$
2.26
$
1.96
$
1.67
Diluted weighted average common shares outstanding
4,503
4,604
4,844
5,095
5,128
Cash dividends declared per common share
$
0.51
$
0.48
$
0.30
$
0.24
$
0.21
Consolidated Balance Sheets Data:
Working capital
$
47,892
$
33,739
$
28,813
$
24,630
$
24,975
Total assets
$
110,903
$
90,266
$
81,745
$
78,274
$
73,476
Notes payable and other borrowings
$
41,958
$
24,097
$
18,427
$
16,421
$
15,863
Our results of operations for fiscal 2015 compared to fiscal 2014 were significantly impacted by movements in international currencies relative to the U.S. Dollar, which decreased our
fiscal 2015 total revenues by 4 percentage points, total operating expenses by 3 percentage points and total operating income by 6 percentage points in comparison to fiscal 2014.
Total working capital sequentially increased in most periods primarily due to the favorable impact to our net current assets resulting from our net income generated during these periods
and the issuances of long-term senior notes of $20.0 billion in fiscal 2015, €2.0 billion and $3.0 billion in fiscal 2014 and $5.0 billion in fiscal 2013. These increases were partially offset
by cash used for acquisitions, repurchases of common stock and dividend payments made in all periods presented and repayments of certain of our senior notes in fiscal 2015, 2013 and
2011.
Our notes payable and other borrowings, which represented the summation of our notes payable, current and other current borrowings, and notes payable and other non-current
borrowings as reported per our consolidated balance sheets as of the dates listed in the table above, increased between fiscal 2011 and fiscal 2015 due to the issuances of long-term senior
notes of $20.0 billion in fiscal 2015, €2.0 billion and $3.0 billion in fiscal 2014, and $5.0 billion in fiscal 2013, and $1.7 billion of short-term borrowings made pursuant to our revolving
credit agreement in fiscal 2012. See Note 8 of Notes to Consolidated Financial Statements included elsewhere in this Annual Report for additional information regarding our notes
payable and other borrowings.
(1)
(2)
(3)
(1)
(2)
(3)