Oracle 2014 Annual Report Download - page 75
Download and view the complete annual report
Please find page 75 of the 2014 Oracle annual report below. You can navigate through the pages in the report by either clicking on the pages listed below, or by using the keyword search tool below to find specific information within the annual report.-
 1
1 -
2
-
3
-
4
-
5
-
6
-
7
-
8
-
9
-
10
-
11
-
12
-
13
-
14
-
15
-
16
-
17
-
18
-
19
-
20
-
21
-
22
-
23
-
24
-
25
-
26
-
27
-
28
-
29
-
30
-
31
-
32
-
33
-
34
-
35
-
36
-
37
-
38
-
39
-
40
-
41
-
42
-
43
-
44
-
45
-
46
-
47
-
48
-
49
-
50
-
51
-
52
-
53
-
54
-
55
-
56
-
57
-
58
-
59
-
60
-
61
-
62
-
63
-
64
-
 65
65 -
 66
66 -
 67
67 -
 68
68 -
 69
69 -
 70
70 -
 71
71 -
 72
72 -
 73
73 -
 74
74 -
 75
75 -
 76
76 -
 77
77 -
 78
78 -
 79
79 -
 80
80 -
 81
81 -
 82
82 -
 83
83 -
 84
84 -
 85
85 -
86
-
87
-
88
-
89
-
90
-
91
-
92
-
93
-
94
-
95
-
96
-
97
-
98
-
99
-
100
-
101
-
102
-
103
-
104
-
105
-
106
-
107
-
108
-
109
-
110
-
111
-
112
-
113
-
114
-
115
-
116
-
117
-
118
-
119
-
120
-
121
-
122
-
123
-
124
-
125
-
126
-
127
-
128
-
129
-
130
-
131
-
132
-
133
-
134
-
135
-
136
-
137
-
138
-
139
-
140
-
141
-
142
-
143
-
144
-
145
-
146
-
147
-
148
-
149
-
150
-
151
-
152
-
153
-
154
-
155
-
156
-
157
-
158
-
159
-
160
-
161
-
162
-
163
-
164
-
165
 |
 |

Table of Contents
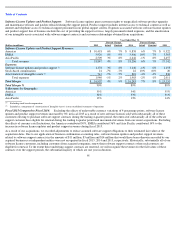
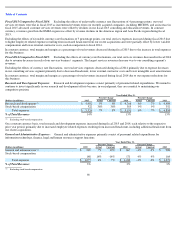
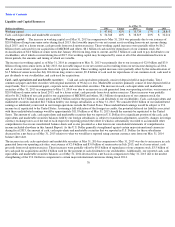
Days sales outstanding, which we calculate by dividing period end accounts receivable by average daily sales for the quarter, was 47 days at
May 31, 2015 compared with 48 days at May 31, 2014. The days sales outstanding calculation excludes the impact of revenue adjustments
resulting from business combinations that reduced our acquired cloud SaaS and PaaS obligations, software license updates and product support
obligations and hardware systems support obligations to fair value.
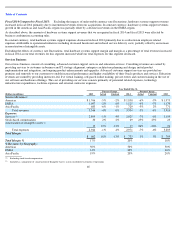
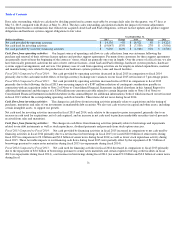
Cash flows from operating activities: Our largest source of operating cash flows is cash collections from our customers following the
purchase and renewal of their software license updates and product support agreements. Payments from customers for these support agreements
are generally received near the beginning of the contracts’
terms, which are generally one year in length. Over the course of a fiscal year, we also
have historically generated cash from the sales of new software licenses, cloud SaaS and PaaS offerings, hardware systems products, hardware
systems support arrangements, and services. Our primary uses of cash from operating activities are for employee related expenditures, material
and manufacturing costs related to the production of our hardware systems products, taxes and leased facilities.
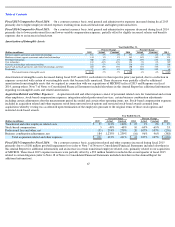
Fiscal 2015 Compared to Fiscal 2014:
Net cash provided by operating activities decreased in fiscal 2015 in comparison to fiscal 2014
primarily due to the cash unfavorable effects of foreign currency exchange rate variances on our fiscal 2015 net income of 7 percentage points.
Fiscal 2014 Compared to Fiscal 2013:
Net cash provided by operating activities increased in fiscal 2014 in comparison to fiscal 2013
primarily due to the following: the fiscal 2013 non-recurring impacts of a $387 million reduction of contingent consideration payable in
connection with an acquisition (refer to Note 2 of Notes to Consolidated Financial Statements included elsewhere in this Annual Report for
additional information) and the impact of a $306 million non-current receivable related to certain litigation (refer to Note 18 of Notes to
Consolidated Financial Statements included elsewhere in this Annual Report for additional information), both of which increased our net income
in fiscal 2013 without the corresponding operating cash flow benefits. These items did not recur during fiscal 2014.
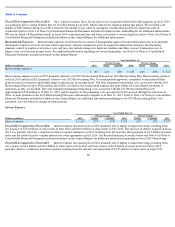
Cash flows from investing activities: The changes in cash flows from investing activities primarily relate to acquisitions and the timing of
purchases, maturities and sales of our investments in marketable debt securities. We also use cash to invest in capital and other assets, including
certain intangible assets, to support our growth.
Net cash used for investing activities increased in fiscal 2015 and 2014, each relative to the respective prior year period, primarily due to an
increase in cash used for acquisitions, net of cash acquired, and an increase in net cash used to purchase marketable securities (net of proceeds
received from sales and maturities).
Cash flows from financing activities: The changes in cash flows from financing activities primarily relate to borrowings and repayments
related to our debt instruments as well as stock repurchases, dividend payments and proceeds from stock option exercises.
Fiscal 2015 Compared to Fiscal 2014:
Net cash provided by financing activities in fiscal 2015 increased in comparison to net cash used by
financing activities in fiscal 2014 primarily due to a net increase in borrowings in fiscal 2015 (we issued $20.0 billion of senior notes during
fiscal 2015 in comparison to €2.0 billion and $3.0 billion of senior notes during fiscal 2014) as well as lower stock repurchase activity during
fiscal 2015. These favorable impacts to our financing cash flows during fiscal 2015 were partially offset by the repayment of $1.5 billion of
borrowings pursuant to senior notes maturities during fiscal 2015 (no repayments during fiscal 2014).
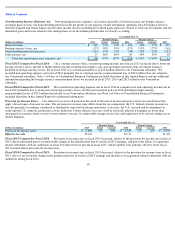
Fiscal 2014 Compared to Fiscal 2013:
Net cash used for financing activities in fiscal 2014 decreased in comparison to fiscal 2013 primarily
due to the repayment of $3.0 billion of borrowings pursuant to senior notes maturities and certain expired revolving credit facilities in fiscal
2013 (no repayments during fiscal 2014), a net increase in borrowings during fiscal 2014 (we issued €2.0 billion and $3.0 billion of senior notes
during fiscal
71
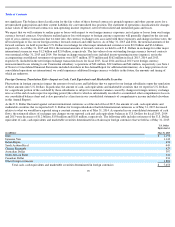
Year Ended May 31,
(Dollars in millions)
2015
Change
2014
Change
2013
Net cash provided by operating activities
$
14,336
-
4%
$
14,921
5%
$
14,224
Net cash used for investing activities
$
(19,047
)
153%
$
(7,539
)
27%
$
(5,956
)
Net cash provided by (used for) financing activities
$
9,850
342%
$
(4,068
)
52%
$
(8,500
)