Oracle 2014 Annual Report Download - page 114
Download and view the complete annual report
Please find page 114 of the 2014 Oracle annual report below. You can navigate through the pages in the report by either clicking on the pages listed below, or by using the keyword search tool below to find specific information within the annual report.-
 1
1 -
2
-
3
-
4
-
5
-
6
-
7
-
8
-
9
-
10
-
11
-
12
-
13
-
14
-
15
-
16
-
17
-
18
-
19
-
20
-
21
-
22
-
23
-
24
-
25
-
26
-
27
-
28
-
29
-
30
-
31
-
32
-
33
-
34
-
35
-
36
-
37
-
38
-
39
-
40
-
41
-
42
-
43
-
44
-
45
-
46
-
47
-
48
-
49
-
50
-
51
-
52
-
53
-
54
-
55
-
56
-
57
-
58
-
59
-
60
-
61
-
62
-
63
-
64
-
65
-
66
-
67
-
68
-
69
-
70
-
71
-
72
-
73
-
74
-
75
-
76
-
77
-
78
-
79
-
80
-
81
-
82
-
83
-
84
-
85
-
86
-
87
-
88
-
89
-
90
-
91
-
92
-
93
-
94
-
95
-
96
-
97
-
98
-
99
-
100
-
101
-
102
-
103
-
 104
104 -
 105
105 -
 106
106 -
 107
107 -
 108
108 -
 109
109 -
 110
110 -
 111
111 -
 112
112 -
 113
113 -
 114
114 -
 115
115 -
 116
116 -
 117
117 -
 118
118 -
 119
119 -
 120
120 -
 121
121 -
 122
122 -
 123
123 -
 124
124 -
125
-
126
-
127
-
128
-
129
-
130
-
131
-
132
-
133
-
134
-
135
-
136
-
137
-
138
-
139
-
140
-
141
-
142
-
143
-
144
-
145
-
146
-
147
-
148
-
149
-
150
-
151
-
152
-
153
-
154
-
155
-
156
-
157
-
158
-
159
-
160
-
161
-
162
-
163
-
164
-
165
 |
 |

Table of Contents
ORACLE CORPORATION
NOTES TO CONSOLIDATED FINANCIAL STATEMENTS—(Continued)
May 31, 2015
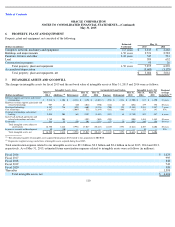
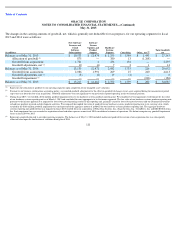
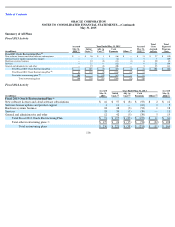
Property, plant and equipment, net consisted of the following:
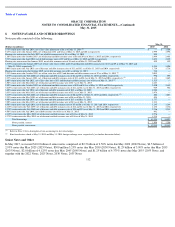
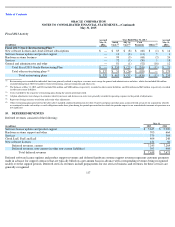
The changes in intangible assets for fiscal 2015 and the net book value of intangible assets at May 31, 2015 and 2014 were as follows:
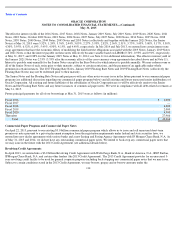
Total amortization expense related to our intangible assets was $2.1 billion, $2.3 billion and $2.4 billion in fiscal 2015, 2014 and 2013,
respectively. As of May 31, 2015, estimated future amortization expenses related to intangible assets were as follows (in millions):
110
6.
PROPERTY, PLANT AND EQUIPMENT
Estimated
Useful Life
May 31,
(Dollars in millions)
2015
2014
Computer, network, machinery and equipment
1
-
5 years
$
3,345
$
2,468
Buildings and improvements
1
-
50 years
2,721
2,582
Furniture, fixtures and other
3
-
10 years
547
531
Land
—
589
632
Construction in progress
—
93
26
Total property, plant and equipment
1
-
50 years
7,295
6,239
Accumulated depreciation
(3,609
)
(3,178
)
Total property, plant and equipment, net
$
3,686
$
3,061
7.
INTANGIBLE ASSETS AND GOODWILL
Intangible Assets, Gross
Accumulated Amortization
Intangible Assets, Net
Weighted
Average
Useful Life
(Dollars in millions)
May 31,
2014
Additions
Retirements
May 31,
2015
May 31,
2014
Expense
Retirements
May 31,
2015
May 31,
2014
May 31,
2015
Software support agreements and related
relationships
$
5,218
$
1,206
$
(2,234
)
$
4,190
$
(4,403
)
$
(531
)
$
2,234
$
(2,700
)
$
815
$
1,490
13 years
Hardware systems support agreements and
related relationships
969
63
(20
)
1,012
(530
)
(144
)
20
(654
)
439
358
10 years
Developed technology
4,387
736
(521
)
4,602
(2,176
)
(700
)
521
(2,355
)
2,211
2,247
7 years
Core technology
1,617
—
(
1,065
)
552
(1,294
)
(182
)
1,065
(411
)
323
141
N.A.
Customer relationships and contract
backlog
2,054
204
(61
)
2,197
(1,459
)
(312
)
61
(1,710
)
595
487
6 years
SaaS, PaaS and IaaS agreements and
related relationships and other.
1,789
204
—
1,993
(305
)
(203
)
—
(
508
)
1,484
1,485
10 years
Trademarks
516
35
(50
)
501
(276
)
(77
)
50
(303
)
240
198
10 years
Total intangible assets subject to
amortization
16,550
2,448
(3,951
)
15,047
(10,443
)
(2,149
)
3,951
(8,641
)
6,107
6,406
10 years
In
-
process research and development
30
(30
)
—
—
—
—
—
—
30
—
N.A.
Total intangible assets, net
$
16,580
$
2,418
$
(3,951
)
$
15,047
$
(10,443
)
$
(2,149
)
$
3,951
$
(8,641
)
$
6,137
$
6,406
The substantial majority of intangible assets acquired during fiscal 2015 related to our acquisition of MICROS.
Represents weighted average useful lives of intangible assets acquired during fiscal 2015.
Fiscal 2016
$
1,624
Fiscal 2017
995
Fiscal 2018
848
Fiscal 2019
742
Fiscal 2020
598
Thereafter
1,599
Total intangible assets, net
$
6,406
(2)
(1)
(1)
(2)