Oracle 2014 Annual Report Download - page 103
Download and view the complete annual report
Please find page 103 of the 2014 Oracle annual report below. You can navigate through the pages in the report by either clicking on the pages listed below, or by using the keyword search tool below to find specific information within the annual report.-
 1
1 -
2
-
3
-
4
-
5
-
6
-
7
-
8
-
9
-
10
-
11
-
12
-
13
-
14
-
15
-
16
-
17
-
18
-
19
-
20
-
21
-
22
-
23
-
24
-
25
-
26
-
27
-
28
-
29
-
30
-
31
-
32
-
33
-
34
-
35
-
36
-
37
-
38
-
39
-
40
-
41
-
42
-
43
-
44
-
45
-
46
-
47
-
48
-
49
-
50
-
51
-
52
-
53
-
54
-
55
-
56
-
57
-
58
-
59
-
60
-
61
-
62
-
63
-
64
-
65
-
66
-
67
-
68
-
69
-
70
-
71
-
72
-
73
-
74
-
75
-
76
-
77
-
78
-
79
-
80
-
81
-
82
-
83
-
84
-
85
-
86
-
87
-
88
-
89
-
90
-
91
-
92
-
 93
93 -
 94
94 -
 95
95 -
 96
96 -
 97
97 -
 98
98 -
 99
99 -
 100
100 -
 101
101 -
 102
102 -
 103
103 -
 104
104 -
 105
105 -
 106
106 -
 107
107 -
 108
108 -
 109
109 -
 110
110 -
 111
111 -
 112
112 -
 113
113 -
114
-
115
-
116
-
117
-
118
-
119
-
120
-
121
-
122
-
123
-
124
-
125
-
126
-
127
-
128
-
129
-
130
-
131
-
132
-
133
-
134
-
135
-
136
-
137
-
138
-
139
-
140
-
141
-
142
-
143
-
144
-
145
-
146
-
147
-
148
-
149
-
150
-
151
-
152
-
153
-
154
-
155
-
156
-
157
-
158
-
159
-
160
-
161
-
162
-
163
-
164
-
165
 |
 |

Table of Contents
ORACLE CORPORATION
NOTES TO CONSOLIDATED FINANCIAL STATEMENTS—(Continued)
May 31, 2015
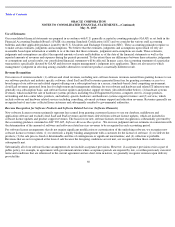
Concentrations of Risk
Financial instruments that are potentially subject to concentrations of credit risk consist primarily of cash and cash equivalents, marketable
securities, derivatives and trade receivables. Our cash and cash equivalents are generally held with large, diverse financial institutions worldwide
to reduce the amount of exposure to any single financial institution. Investment policies have been implemented that limit purchases of
marketable debt securities to investment grade securities. Our derivative contracts are transacted with various financial institutions with high
credit standings. We generally do not require collateral to secure accounts receivable. The risk with respect to trade receivables is mitigated by
credit evaluations we perform on our customers, the short duration of our payment terms for the significant majority of our customer contracts
and by the diversification of our customer base. No single customer accounted for 10% or more of our total revenues in fiscal 2015, 2014 or
2013.
We outsource the design, manufacturing, assembly and delivery of certain of our hardware products to a variety of companies, many of which
are located outside the United States. Further, we have simplified our supply chain processes by reducing the number of third party
manufacturing partners and the number of locations where these third party manufacturers build our hardware systems products. The inability of
these third party manufacturing partners to fulfill orders for our hardware products could adversely impact future operating results of our
hardware systems business.
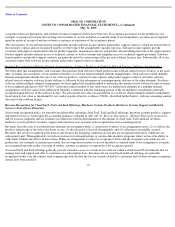
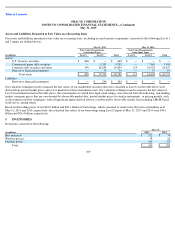
Inventories
Inventories are stated at the lower of cost or market value. Cost is computed using standard cost, which approximates actual cost, on a first-in,
first-out basis. We evaluate our ending inventories for estimated excess quantities and obsolescence. This evaluation includes analysis of sales
levels by product and projections of future demand within specific time horizons (generally six to nine months). Inventories in excess of future
demand are written down and charged to hardware systems products expenses. In addition, we assess the impact of changing technology to our
inventories and we write down inventories that are considered obsolete. At the point of loss recognition, a new, lower-cost basis for that
inventory is established, and subsequent changes in facts and circumstances do not result in the restoration or increase in that newly established
cost basis.
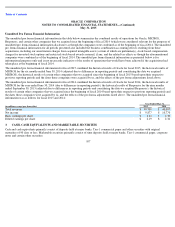
Other Receivables
Other receivables represent value-added tax and sales tax receivables associated with the sale of our products and services to third parties. Other
receivables are included in prepaid expenses and other current assets in our consolidated balance sheets and totaled $817 million and $906
million at May 31, 2015 and 2014, respectively.
Deferred Sales Commissions
We defer sales commission expenses associated with our cloud SaaS, PaaS and IaaS offerings, and recognize the related expenses over the non-
cancelable term of the related contracts, which are typically one to three years. Amortization of deferred sales commissions is included as a
component of sales and marketing expense in our consolidated statements of operations.
Property, Plant and Equipment
Property, plant and equipment are stated at the lower of cost or realizable value, net of accumulated depreciation. Depreciation is computed
using the straight-line method based on estimated useful lives of the assets, which range from one to fifty years. Leasehold improvements are
amortized over the lesser of the estimated useful lives of the improvements or the lease terms, as appropriate. Property, plant and equipment are
periodically reviewed for impairment whenever events or changes in circumstances indicate that the carrying amount of an asset may not be
recoverable. We did not recognize any significant property impairment charges in fiscal 2015, 2014 or 2013.
99