Oracle 2014 Annual Report Download - page 73
Download and view the complete annual report
Please find page 73 of the 2014 Oracle annual report below. You can navigate through the pages in the report by either clicking on the pages listed below, or by using the keyword search tool below to find specific information within the annual report.-
 1
1 -
2
-
3
-
4
-
5
-
6
-
7
-
8
-
9
-
10
-
11
-
12
-
13
-
14
-
15
-
16
-
17
-
18
-
19
-
20
-
21
-
22
-
23
-
24
-
25
-
26
-
27
-
28
-
29
-
30
-
31
-
32
-
33
-
34
-
35
-
36
-
37
-
38
-
39
-
40
-
41
-
42
-
43
-
44
-
45
-
46
-
47
-
48
-
49
-
50
-
51
-
52
-
53
-
54
-
55
-
56
-
57
-
58
-
59
-
60
-
61
-
62
-
 63
63 -
 64
64 -
 65
65 -
 66
66 -
 67
67 -
 68
68 -
 69
69 -
 70
70 -
 71
71 -
 72
72 -
 73
73 -
 74
74 -
 75
75 -
 76
76 -
 77
77 -
 78
78 -
 79
79 -
 80
80 -
 81
81 -
 82
82 -
 83
83 -
84
-
85
-
86
-
87
-
88
-
89
-
90
-
91
-
92
-
93
-
94
-
95
-
96
-
97
-
98
-
99
-
100
-
101
-
102
-
103
-
104
-
105
-
106
-
107
-
108
-
109
-
110
-
111
-
112
-
113
-
114
-
115
-
116
-
117
-
118
-
119
-
120
-
121
-
122
-
123
-
124
-
125
-
126
-
127
-
128
-
129
-
130
-
131
-
132
-
133
-
134
-
135
-
136
-
137
-
138
-
139
-
140
-
141
-
142
-
143
-
144
-
145
-
146
-
147
-
148
-
149
-
150
-
151
-
152
-
153
-
154
-
155
-
156
-
157
-
158
-
159
-
160
-
161
-
162
-
163
-
164
-
165
 |
 |

Table of Contents
Non
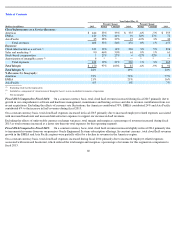
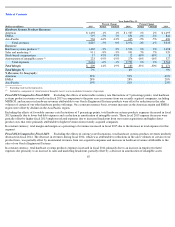
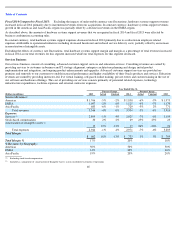
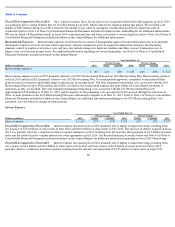
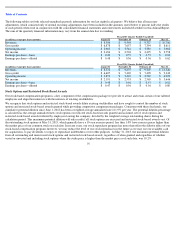
-Operating Income (Expense), net: Non-operating income (expense), net consists primarily of interest income, net foreign currency
exchange gains (losses), the noncontrolling interests in the net profits of our majority-owned subsidiaries (primarily Oracle Financial Services
Software Limited and Oracle Japan) and net other income (losses) including net realized gains and losses related to all of our investments and net
unrealized gains and losses related to the small portion of our investment portfolio that we classify as trading.
Fiscal 2015 Compared to Fiscal 2014: On a constant currency basis, our non-operating income, net in fiscal 2015 increased due to lower net
foreign currency losses and due to higher interest income resulting from higher cash, cash equivalent and short-term investment balances.
Included in foreign currency losses, net in fiscal 2015 was a remeasurement loss of $23 million related to our Venezuelan subsidiary. We
recorded non-operating expense, net in fiscal 2014 primarily due to a foreign currency remeasurement loss of $213 million that also related to
our Venezuelan subsidiary. Note 1 of Notes to Consolidated Financial Statements included elsewhere in this Annual Report contains additional
information regarding the foreign currency remeasurement losses we incurred in fiscal 2015, 2014 and 2013 related to our Venezuelan
subsidiary.
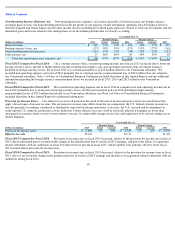
Fiscal 2014 Compared to Fiscal 2013: We recorded non-operating expense, net in fiscal 2014 in comparison to non-operating income, net in
fiscal 2013 primarily due to an increase in foreign currency losses, net that were incurred in fiscal 2014 including foreign currency
remeasurement losses of $213 million that related to our Venezuelan subsidiary (see Note 1 of Notes to Consolidated Financial Statements
included elsewhere in this Annual Report for additional information).
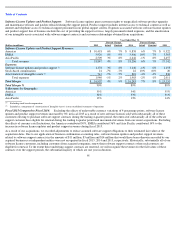
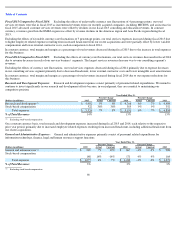
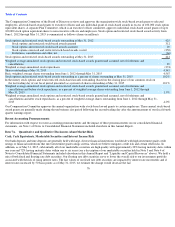
Provision for Income Taxes:
Our effective tax rate in all periods is the result of the mix of income earned in various tax jurisdictions that
apply a broad range of income tax rates. The provision for income taxes differs from the tax computed at the U.S. federal statutory income tax
rate due primarily to earnings considered as indefinitely reinvested in foreign operations, state taxes, the U.S. research and development tax
credit and the U.S. domestic production activity deduction. Future effective tax rates could be adversely affected if earnings are lower than
anticipated in countries where we have lower statutory tax rates, by unfavorable changes in tax laws and regulations or by adverse rulings in tax
related litigation.
Fiscal 2015 Compared to Fiscal 2014: Provision for income taxes in fiscal 2015 increased, relative to the provision for income taxes in fiscal
2014, due in substantial part to an unfavorable change in the jurisdictional mix of our fiscal 2015 earnings, and due to the effects of acquisition
related settlements with tax authorities in fiscal 2014 that were not present in fiscal 2015, which together were partially offset by lower fiscal
2015 income before provision for income taxes.
Fiscal 2014 Compared to Fiscal 2013:
Provision for income taxes in fiscal 2014 decreased, relative to the provision for income taxes in fiscal
2013, due to a tax favorable change in the jurisdictional mix of our fiscal 2014 earnings and the effects of acquisition related settlements with tax
authorities during fiscal 2014.
69
Year Ended May 31,
Percent Change
Percent Change
(Dollars in millions)
2015
Actual
Constant
2014
Actual
Constant
2013
Interest income
$
349
33%
33%
$
263
10%
17%
$
237
Foreign currency losses, net
(157
)
-
58%
-
59%
(375
)
131%
127%
(162
)
Noncontrolling interests in income
(113
)
15%
15%
(98
)
-
12%
-
12%
(112
)
Other income, net
27
-
60%
-
60%
69
44%
44%
48
Total non
-
operating income (expense), net
$
106
175%
187%
$
(141
)
1,343%
1,749%
$
11
Year Ended May 31,
Percent Change
Percent Change
(Dollars in millions)
2015
Actual
Constant
2014
Actual
Constant
2013
Provision for income taxes
$
2,896
5%
13%
$
2,749
-
7%
-
6%
$
2,973
Effective tax rate
22.6%
20.1%
21.4%