Napa Auto Parts 2015 Annual Report Download - page 75
Download and view the complete annual report
Please find page 75 of the 2015 Napa Auto Parts annual report below. You can navigate through the pages in the report by either clicking on the pages listed below, or by using the keyword search tool below to find specific information within the annual report.-
 1
1 -
2
-
3
-
4
-
5
-
6
-
7
-
8
-
9
-
10
-
11
-
12
-
13
-
14
-
15
-
16
-
17
-
18
-
19
-
20
-
21
-
22
-
23
-
24
-
25
-
26
-
27
-
28
-
29
-
30
-
31
-
32
-
33
-
34
-
35
-
36
-
37
-
38
-
39
-
40
-
41
-
42
-
43
-
44
-
45
-
46
-
47
-
48
-
49
-
50
-
51
-
52
-
53
-
54
-
55
-
56
-
57
-
58
-
59
-
60
-
61
-
62
-
63
-
64
-
 65
65 -
 66
66 -
 67
67 -
 68
68 -
 69
69 -
 70
70 -
 71
71 -
 72
72 -
 73
73 -
 74
74 -
 75
75 -
 76
76 -
 77
77 -
 78
78 -
 79
79 -
 80
80 -
 81
81 -
 82
82 -
 83
83 -
 84
84 -
 85
85 -
86
-
87
-
88
-
89
-
90
-
91
 |
 |

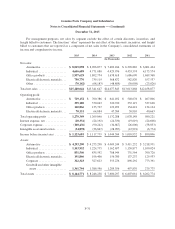
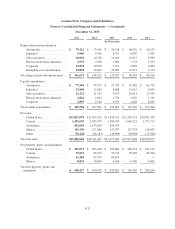
Genuine Parts Company and Subsidiaries
Notes to Consolidated Financial Statements — (Continued)
December 31, 2015
2015 2014 2013 2012 2011
(In Thousands)
Depreciation and amortization:
Automotive ................. $ 70,112 $ 77,645 $ 76,238 $ 60,630 $ 60,252
Industrial ................... 9,960 9,906 8,751 8,307 7,495
Office products .............. 10,922 10,728 10,166 10,837 9,999
Electrical/electronic materials . . . 2,933 2,658 1,904 1,733 1,554
Corporate ................... 12,870 10,509 7,911 3,885 2,862
Intangible asset amortization .... 34,878 36,867 28,987 12,991 6,774
Total depreciation and amortization . . $ 141,675 $ 148,313 $ 133,957 $ 98,383 $ 88,936
Capital expenditures:
Automotive ................. $ 77,504 $ 78,537 $ 97,735 $ 67,482 $ 61,795
Industrial ................... 13,998 12,442 8,808 13,015 9,851
Office products .............. 12,323 11,135 9,297 16,013 22,036
Electrical/electronic materials . . . 2,824 3,003 1,730 1,029 1,762
Corporate ................... 2,895 2,564 6,493 4,448 8,025
Total capital expenditures .......... $ 109,544 $ 107,681 $ 124,063 $ 101,987 $ 103,469
Net sales:
United States ................ $12,843,078 $12,565,329 $11,594,713 $11,299,291 $10,791,303
Canada ..................... 1,395,695 1,583,075 1,560,799 1,616,921 1,571,733
Australasia .................. 992,064 1,133,620 839,353 — —
Mexico ..................... 119,349 127,806 131,787 127,754 118,867
Other ...................... (70,142) (68,183) (48,809) (30,098) (23,026)
Total net sales ................... $15,280,044 $15,341,647 $14,077,843 $13,013,868 $12,458,877
Net property, plant, and equipment:
United States ................ $ 495,073 $ 495,452 $ 503,882 $ 466,473 $ 411,193
Canada ..................... 79,023 98,939 99,135 93,496 84,210
Australasia .................. 65,289 65,707 60,614 — —
Mexico ..................... 8,832 10,004 6,430 6,396 4,801
Total net property, plant, and
equipment .................... $ 648,217 $ 670,102 $ 670,061 $ 566,365 $ 500,204
F-32