Napa Auto Parts 2015 Annual Report Download - page 72
Download and view the complete annual report
Please find page 72 of the 2015 Napa Auto Parts annual report below. You can navigate through the pages in the report by either clicking on the pages listed below, or by using the keyword search tool below to find specific information within the annual report.-
 1
1 -
2
-
3
-
4
-
5
-
6
-
7
-
8
-
9
-
10
-
11
-
12
-
13
-
14
-
15
-
16
-
17
-
18
-
19
-
20
-
21
-
22
-
23
-
24
-
25
-
26
-
27
-
28
-
29
-
30
-
31
-
32
-
33
-
34
-
35
-
36
-
37
-
38
-
39
-
40
-
41
-
42
-
43
-
44
-
45
-
46
-
47
-
48
-
49
-
50
-
51
-
52
-
53
-
54
-
55
-
56
-
57
-
58
-
59
-
60
-
61
-
 62
62 -
 63
63 -
 64
64 -
 65
65 -
 66
66 -
 67
67 -
 68
68 -
 69
69 -
 70
70 -
 71
71 -
 72
72 -
 73
73 -
 74
74 -
 75
75 -
 76
76 -
 77
77 -
 78
78 -
 79
79 -
 80
80 -
 81
81 -
 82
82 -
83
-
84
-
85
-
86
-
87
-
88
-
89
-
90
-
91
 |
 |

Genuine Parts Company and Subsidiaries
Notes to Consolidated Financial Statements — (Continued)
December 31, 2015
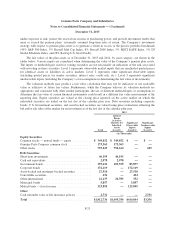
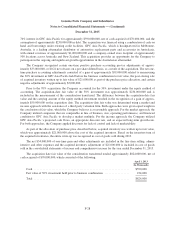
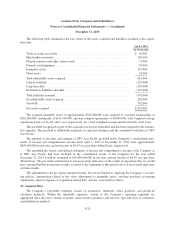
The following table summarizes the fair values of the assets acquired and liabilities assumed at the acquis-
ition date.
April 1, 2013
(In Thousands)
Trade accounts receivable ................................................ $ 94,000
Merchandise inventory ................................................... 306,000
Prepaid expenses and other current assets .................................... 31,000
Property and equipment .................................................. 59,000
Intangible assets ........................................................ 347,000
Other assets ............................................................ 24,000
Total identifiable assets acquired ........................................... 861,000
Current liabilities ....................................................... (224,000)
Long-term debt ......................................................... (230,000)
Deferred tax liabilities and other ........................................... (125,000)
Total liabilities assumed .................................................. (579,000)
Net identifiable assets acquired ............................................ 282,000
Goodwill .............................................................. 542,000
Net assets acquired ...................................................... $824,000
The acquired intangible assets of approximately $347,000,000 were assigned to customer relationships of
$202,000,000, trademarks of $141,000,000, and non-compete agreements of $4,000,000, with weighted average
amortization lives of 16, 40, and 1 year, respectively, for a total weighted average amortization life of 26 years.
The goodwill recognized as part of the acquisition is not tax deductible and has been assigned to the automo-
tive segment. The goodwill is attributable primarily to expected synergies and the assembled workforce of GPC
Asia Pacific.
The amounts of net sales and earnings of GPC Asia Pacific included in the Company’s consolidated state-
ments of income and comprehensive income from April 1, 2013 to December 31, 2013 were approximately
$839,000,000 in net sales and net income of $0.43 on a per share diluted basis, respectively.
The unaudited pro forma consolidated statements of income and comprehensive income of the Company as
if GPC Asia Pacific had been included in the consolidated results of the Company for the year ended
December 31, 2013 would be estimated at $14,400,000,000 in net sales and net income of $4.42 on a per share
diluted basis. The pro forma information is not necessarily indicative of the results of operations that we would
have reported had the transaction actually occurred at the beginning of this period, nor is it necessarily indicative
of future results.
The adjustments to the pro forma amounts include, but are not limited to, applying the Company’s account-
ing policies, amortization related to fair value adjustments to intangible assets, one-time purchase accounting
adjustments, interest expense on acquisition related debt, and any associated tax effects.
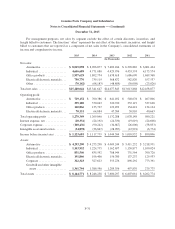
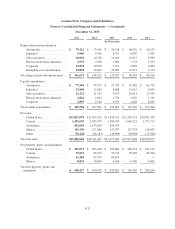
10. Segment Data
The Company’s reportable segments consist of automotive, industrial, office products, and electrical/
electronic materials. Within the reportable segments, certain of the Company’s operating segments are
aggregated since they have similar economic characteristics, products and services, type and class of customers,
and distribution methods.
F-29