Napa Auto Parts 2015 Annual Report Download - page 28
Download and view the complete annual report
Please find page 28 of the 2015 Napa Auto Parts annual report below. You can navigate through the pages in the report by either clicking on the pages listed below, or by using the keyword search tool below to find specific information within the annual report.-
 1
1 -
2
-
3
-
4
-
5
-
6
-
7
-
8
-
9
-
10
-
11
-
12
-
13
-
14
-
15
-
16
-
17
-
 18
18 -
 19
19 -
 20
20 -
 21
21 -
 22
22 -
 23
23 -
 24
24 -
 25
25 -
 26
26 -
 27
27 -
 28
28 -
 29
29 -
 30
30 -
 31
31 -
 32
32 -
 33
33 -
 34
34 -
 35
35 -
 36
36 -
 37
37 -
 38
38 -
39
-
40
-
41
-
42
-
43
-
44
-
45
-
46
-
47
-
48
-
49
-
50
-
51
-
52
-
53
-
54
-
55
-
56
-
57
-
58
-
59
-
60
-
61
-
62
-
63
-
64
-
65
-
66
-
67
-
68
-
69
-
70
-
71
-
72
-
73
-
74
-
75
-
76
-
77
-
78
-
79
-
80
-
81
-
82
-
83
-
84
-
85
-
86
-
87
-
88
-
89
-
90
-
91
 |
 |
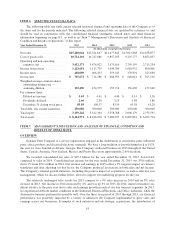
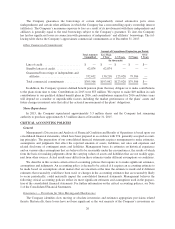
Non-Operating Expenses and Income
Non-operating expenses consist primarily of interest. Interest expense was $22 million in 2015, $25 million
in 2014 and $27 million in 2013. The $3 million decrease in interest expense in 2015 reflects the impact of lower
outstanding debt levels during the year relative to 2014. The $2 million decrease in interest expense in 2014
reflects the favorable interest rate on certain debt, which was renewed in November 2013.
In “Other”, the net benefit of interest income, equity method investment income, investment dividends and
noncontrolling interests in 2015 was $21 million, a $2 million increase from the prior year due to higher interest
income earned in 2015 relative to 2014. These items were $19 million in 2014, down from $22 million in 2013.
The decrease of $3 million from the prior year was due to lower interest income earned in 2014 relative to 2013.
Income Before Income Taxes
Income before income taxes was $1.1 billion in 2015, a slight increase from 2014. As a percentage of net
sales, income before income taxes was 7.4% in 2015 compared to 7.3% in 2014. In 2014, income before income
taxes of $1.1 billion was up 7% from 2013 and as a percentage of net sales was 7.3% compared to 7.4% in 2013.
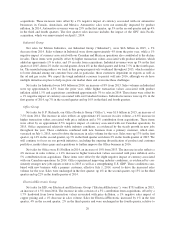
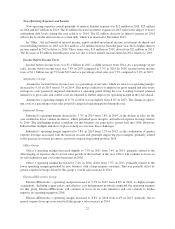
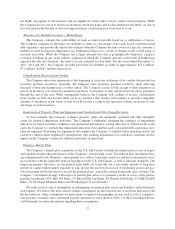
Automotive Group
Automotive income before income taxes as a percentage of net sales, which we refer to as operating margin,
increased to 9.1% in 2015 from 8.7% in 2014. This group’s initiatives to improve its gross margin and effectively
manage its costs positively impacted Automotive’s operating profit during the year. Looking forward, planned
initiatives to grow sales and control costs are intended to further improve its operating margin in the years ahead.
Automotive’s operating margin of 8.7% in 2014 was up slightly from 8.6% in 2013. The change in operat-
ing costs as a percentage of net sales positively impacted operating profit during the year.
Industrial Group
Industrial’s operating margin decreased to 7.3% in 2015 from 7.8% in 2014, as the decline in sales for the
year resulted in lower volume incentives, which pressured gross margins, and reduced expense leverage relative
to 2014. The challenging market conditions for this business are expected to persist well into 2016. However,
Industrial has multiple initiatives in place to help us overcome these challenges.
Industrial’s operating margin improved to 7.8% in 2014 from 7.2% in 2013, as the combination of greater
expense leverage associated with the increase in sales and generally improving gross margins, primarily related
to the increase in volume incentives, positively impacted operating profit in 2014.
Office Group
Office’s operating margin decreased slightly to 7.3% in 2015 from 7.4% in 2014, primarily related to the
deleveraging of expenses due to slower sales growth in the last half of the year. Office will continue to focus on
its sales initiatives and cost control measures in 2016.
Office’s operating margin decreased to 7.4% in 2014, down from 7.5% in 2013, primarily related to the
lower operating margin generated by new business with a large primary customer. This was partially offset by
greater expense leverage driven by this group’s overall sales increase in 2014.
Electrical/Electronic Group
Electrical/Electronic’s operating margin increased to 9.3% in 2015 from 8.8% in 2014, as higher margin
acquisitions, declining copper prices and effective cost management positively impacted the operating margins
for this group. Electrical/Electronic will continue to focus on its sales initiatives and cost controls to further
improve its operating margin in 2016.
Electrical/Electronic’s operating margin increased to 8.8% in 2014 from 8.4% in 2013, primarily due to
greater expense leverage associated with this group’s sales increase in 2014.
22