Napa Auto Parts 2015 Annual Report Download - page 29
Download and view the complete annual report
Please find page 29 of the 2015 Napa Auto Parts annual report below. You can navigate through the pages in the report by either clicking on the pages listed below, or by using the keyword search tool below to find specific information within the annual report.-
 1
1 -
2
-
3
-
4
-
5
-
6
-
7
-
8
-
9
-
10
-
11
-
12
-
13
-
14
-
15
-
16
-
17
-
18
-
 19
19 -
 20
20 -
 21
21 -
 22
22 -
 23
23 -
 24
24 -
 25
25 -
 26
26 -
 27
27 -
 28
28 -
 29
29 -
 30
30 -
 31
31 -
 32
32 -
 33
33 -
 34
34 -
 35
35 -
 36
36 -
 37
37 -
 38
38 -
 39
39 -
40
-
41
-
42
-
43
-
44
-
45
-
46
-
47
-
48
-
49
-
50
-
51
-
52
-
53
-
54
-
55
-
56
-
57
-
58
-
59
-
60
-
61
-
62
-
63
-
64
-
65
-
66
-
67
-
68
-
69
-
70
-
71
-
72
-
73
-
74
-
75
-
76
-
77
-
78
-
79
-
80
-
81
-
82
-
83
-
84
-
85
-
86
-
87
-
88
-
89
-
90
-
91
 |
 |

Income Taxes
The effective income tax rate of 37.2% in 2015 increased from 36.4% in 2014. The increase in rate primar-
ily reflects the Company’s higher mix of U.S. earnings in 2015, which is taxed at a higher rate relative to our
foreign operations. To a lesser extent, the less favorable retirement asset valuation adjustment in 2015 relative to
2014 impacted the increase in rate.
The income tax rate of 36.4% in 2014 increased from 34.4% in 2013. The increase in rate is primarily due to
the favorable tax rate applied to the one-time gain associated with the GPC Asia Pacific acquisition recorded in
2013. Additionally, the Company’s retirement asset valuation adjustment was less favorable in 2014 relative to
2013. The higher mix of U.S. earnings, taxed at a higher rate relative to our foreign operations, also contributed
to the increase in the 2014 tax rate.
Net Income
Net income was $706 million in 2015, a decrease of 1% from $711 million in 2014. On a per share diluted
basis, net income was $4.63 in 2015, up slightly compared to $4.61 in 2014. Net income was 4.6% of net sales in
2015 and 2014.
Net income was $711 million in 2014, an increase of 4% from $685 million in 2013. On a per share diluted
basis, net income was $4.61 in 2014 compared to $4.40 in 2013, up 5%. Net income in 2014 was 4.6% of net
sales compared to 4.9% of net sales in 2013.
In connection with the acquisition of GPC Asia Pacific, the Company recorded one-time positive purchase
accounting adjustments of $33 million or $0.21 per diluted share in 2013. Before the impact of these adjustments,
net income in 2014 was up 9% from 2013, and on a per share diluted basis, net income was up 10% from 2013.
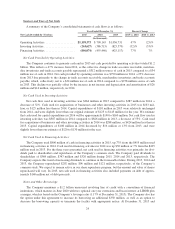
FINANCIAL CONDITION
Our cash balance of $212 million at December 31, 2015 compares to our cash balance of $138 million at
December 31, 2014, as discussed further below. The Company’s accounts receivable balance at December 31,
2015 decreased by approximately 3% from the prior year. This compares to the Company’s 4% sales decrease for
the fourth quarter of 2015, and we are satisfied with the quality and collectability of our accounts receivable.
Inventory at December 31, 2015 decreased by approximately 1% from December 31, 2014 and accounts payable
increased $267 million or approximately 10% from December 31, 2014 due primarily to improved payment
terms with certain suppliers.
LIQUIDITY AND CAPITAL RESOURCES
The Company’s sources of capital consist primarily of cash flows from operations, supplemented as neces-
sary by private issuances of debt and bank borrowings. We have $625 million of total debt outstanding at
December 31, 2015, of which $250 million matures in November 2016 and $250 million matures in December
2023. In addition, the Company has an unsecured revolving line of credit with a consortium of financial
institutions for $1.2 billion, of which approximately $125 million and $265 million were outstanding under the
line of credit at December 31, 2015 and 2014, respectively. Currently, we believe that our cash on hand and
available short-term and long-term sources of capital are sufficient to fund the Company’s operations, including
working capital requirements, scheduled debt payments, interest payments, capital expenditures, benefit plan
contributions, income tax obligations, dividends, share repurchases and contemplated acquisitions.
The ratio of current assets to current liabilities was 1.4 to 1 at December 31, 2015 and 1.6 to 1 at
December 31, 2014. Our liquidity position remains solid. The Company’s total debt outstanding at December 31,
2015 is down $140 million or 18% from December 31, 2014.
23