Napa Auto Parts 2015 Annual Report Download - page 56
Download and view the complete annual report
Please find page 56 of the 2015 Napa Auto Parts annual report below. You can navigate through the pages in the report by either clicking on the pages listed below, or by using the keyword search tool below to find specific information within the annual report.-
 1
1 -
2
-
3
-
4
-
5
-
6
-
7
-
8
-
9
-
10
-
11
-
12
-
13
-
14
-
15
-
16
-
17
-
18
-
19
-
20
-
21
-
22
-
23
-
24
-
25
-
26
-
27
-
28
-
29
-
30
-
31
-
32
-
33
-
34
-
35
-
36
-
37
-
38
-
39
-
40
-
41
-
42
-
43
-
44
-
45
-
 46
46 -
 47
47 -
 48
48 -
 49
49 -
 50
50 -
 51
51 -
 52
52 -
 53
53 -
 54
54 -
 55
55 -
 56
56 -
 57
57 -
 58
58 -
 59
59 -
 60
60 -
 61
61 -
 62
62 -
 63
63 -
 64
64 -
 65
65 -
 66
66 -
67
-
68
-
69
-
70
-
71
-
72
-
73
-
74
-
75
-
76
-
77
-
78
-
79
-
80
-
81
-
82
-
83
-
84
-
85
-
86
-
87
-
88
-
89
-
90
-
91
 |
 |
Genuine Parts Company and Subsidiaries
Notes to Consolidated Financial Statements — (Continued)
December 31, 2015
The accumulated other comprehensive loss components related to the pension benefits are included in the
computation of net periodic benefit (income) cost in the employee benefit plans footnote.
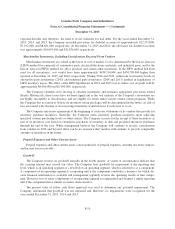
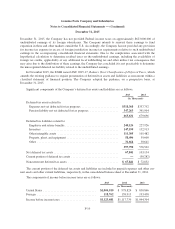
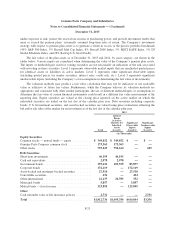
Fair Value of Financial Instruments
The carrying amounts reflected in the consolidated balance sheets for cash and cash equivalents, trade
accounts receivable, trade accounts payable, and borrowings under the line of credit approximate their respective
fair values based on the short-term nature of these instruments. At December 31, 2015 and 2014, the fair value of
fixed rate debt was approximately $501,000,000 and $505,000,000, respectively. The fair value of fixed rate debt
is designated as Level 2 in the fair value hierarchy (i.e., significant observable inputs) and is based primarily on
the discounted value of future cash flows using current market interest rates offered for debt of similar credit risk
and maturity. At December 31, 2015 and 2014, the carrying value of fixed rate debt was $500,000,000 and is
included in current portion of debt and long-term debt in the consolidated balance sheets.
Shipping and Handling Costs
Shipping and handling costs are classified as selling, administrative and other expenses in the accompanying
consolidated statements of income and comprehensive income and totaled approximately $270,000,000,
$270,000,000, and $250,000,000, for the years ended December 31, 2015, 2014, and 2013, respectively.
Advertising Costs
Advertising costs are expensed as incurred and totaled $75,000,000, $71,300,000, and $57,900,000 in the
years ended December 31, 2015, 2014, and 2013, respectively.
Accounting for Legal Costs
The Company’s legal costs expected to be incurred in connection with loss contingencies are expensed as
such costs are incurred.
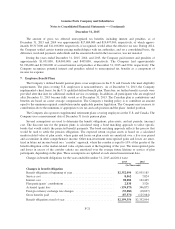
Share-Based Compensation
The Company maintains various long-term incentive plans, which provide for the granting of stock options,
stock appreciation rights (SARs), restricted stock, restricted stock units (RSUs), performance awards, dividend
equivalents and other share-based awards. SARs represent a right to receive upon exercise an amount, payable in
shares of common stock, equal to the excess, if any, of the fair market value of the Company’s common stock on
the date of exercise over the base value of the grant. The terms of such SARs require net settlement in shares of
common stock and do not provide for cash settlement. RSUs represent a contingent right to receive one share of
the Company’s common stock at a future date. The majority of awards previously granted vest on a pro-rata basis
for periods ranging from one to five years and are expensed accordingly on a straight-line basis. The Company
issues new shares upon exercise or conversion of awards under these plans.
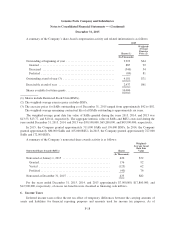
Net Income per Common Share
Basic net income per common share is computed by dividing net income by the weighted average number of
common shares outstanding during the year. The computation of diluted net income per common share includes
the dilutive effect of stock options, stock appreciation rights and nonvested restricted stock awards options.
Options to purchase approximately 1,280,000, 610,000, and 630,000 shares of common stock ranging from $77
— $92 per share were outstanding at December 31, 2015, 2014, and 2013, respectively. These options were
excluded from the computation of diluted net income per common share because the options’ exercise prices
were greater than the average market prices of common stock in each respective year.
F-13