Napa Auto Parts 2015 Annual Report Download - page 25
Download and view the complete annual report
Please find page 25 of the 2015 Napa Auto Parts annual report below. You can navigate through the pages in the report by either clicking on the pages listed below, or by using the keyword search tool below to find specific information within the annual report.-
 1
1 -
2
-
3
-
4
-
5
-
6
-
7
-
8
-
9
-
10
-
11
-
12
-
13
-
14
-
 15
15 -
 16
16 -
 17
17 -
 18
18 -
 19
19 -
 20
20 -
 21
21 -
 22
22 -
 23
23 -
 24
24 -
 25
25 -
 26
26 -
 27
27 -
 28
28 -
 29
29 -
 30
30 -
 31
31 -
 32
32 -
 33
33 -
 34
34 -
 35
35 -
36
-
37
-
38
-
39
-
40
-
41
-
42
-
43
-
44
-
45
-
46
-
47
-
48
-
49
-
50
-
51
-
52
-
53
-
54
-
55
-
56
-
57
-
58
-
59
-
60
-
61
-
62
-
63
-
64
-
65
-
66
-
67
-
68
-
69
-
70
-
71
-
72
-
73
-
74
-
75
-
76
-
77
-
78
-
79
-
80
-
81
-
82
-
83
-
84
-
85
-
86
-
87
-
88
-
89
-
90
-
91
 |
 |

new and expanded product lines, geographic expansion, sales to new markets, enhanced customer marketing
programs and a variety of gross margin and cost savings initiatives. We discuss these initiatives further below.
With regard to the December 31, 2015 consolidated balance sheet, the Company’s cash balance of $212
million compares to cash of $138 million at December 31, 2014. The Company continues to maintain a strong
cash position, supported by relatively steady net income and effective asset management in 2015. Accounts
receivable decreased by approximately 3%, which compares to an approximate 4% sales decrease in the fourth
quarter of the year, and inventory was down by approximately 1%. Accounts payable increased $267 million or
10% from the prior year, due primarily to improved payment terms with certain suppliers. Total debt outstanding
at December 31, 2015 was $625 million, down from total debt of $765 at December 31, 2014.
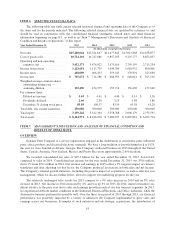
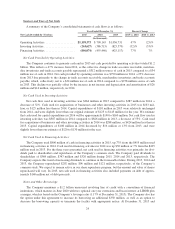
RESULTS OF OPERATIONS
Our results of operations are summarized below for the three years ended December 31, 2015, 2014 and
2013.
Year Ended December 31,
2015 2014 2013
(In thousands except per share data)
Net sales .................................... $15,280,044 $15,341,647 $14,077,843
Gross profit .................................. 4,555,852 4,593,761 4,219,920
Net income .................................. 705,672 711,286 684,959
Diluted earnings per share ....................... 4.63 4.61 4.40
Net Sales
Consolidated net sales for the year ended December 31, 2015 totaled $15.3 billion, down slightly from
2014. 2015 net sales included a 1.5% increase in sales volume and a 1% contribution from acquisitions, offset by
an approximate 3% negative impact of currency. The impact of product inflation varied by business in 2015 and,
cumulatively, prices were down 0.2% in the Automotive segment, up approximately 0.9% in the Industrial seg-
ment, up approximately 0.6% in the Office segment and down approximately 1.7% in the Electrical/Electronic
segment. The Company is well positioned with strategic plans in place to grow sales in 2016.
Consolidated net sales for the year ended December 31, 2014 totaled $15.3 billion, a 9% increase from 2013
and driven by revenue growth in each of our four business segments. The increase in sales volume and acquis-
itions across our four businesses each contributed 5% to our total sales growth, while currency negatively
impacted total sales by 1%. The impact of product inflation varied by business in 2014 and, cumulatively, prices
were flat in the Automotive segment, up approximately 1.5% in the Industrial segment, up approximately 1.4%
in the Office segment and up approximately 0.3% in the Electrical/Electronic segment.
Automotive Group
Net sales for the Automotive Group (“Automotive”) were $8.0 billion in 2015, a 1% decrease from 2014.
The decrease in sales for the year consists of a positive core sales increase of approximately 3.5% and a slight
benefit from acquisitions. Combined, the approximate 4% growth was offset by a 5% negative impact of cur-
rency associated with our automotive businesses in Canada, Australasia and Mexico. Automotive sales were not
materially impacted by product inflation. In 2015, Automotive revenues were flat in the first and second quarters
and down 2% in the third and fourth quarters. We believe that the underlying fundamentals in the automotive
aftermarket, including the overall number and age of the vehicle population as well as the positive increase in
miles driven, remain solid and will serve to drive sustained demand for automotive aftermarket maintenance and
supply items in 2016. Despite the expectation for continued headwinds associated with the strong U.S. dollar and
related impact of currency, we expect these fundamentals and the internal growth initiatives in our Automotive
business to drive sales growth for this group in 2016.
Net sales for Automotive were $8.1 billion in 2014, an increase of 8% from 2013. The increase in sales for
the year consists of a positive comparable store sales increase of approximately 6% and approximately 4% from
19