Napa Auto Parts 2015 Annual Report Download - page 30
Download and view the complete annual report
Please find page 30 of the 2015 Napa Auto Parts annual report below. You can navigate through the pages in the report by either clicking on the pages listed below, or by using the keyword search tool below to find specific information within the annual report.-
 1
1 -
2
-
3
-
4
-
5
-
6
-
7
-
8
-
9
-
10
-
11
-
12
-
13
-
14
-
15
-
16
-
17
-
18
-
19
-
 20
20 -
 21
21 -
 22
22 -
 23
23 -
 24
24 -
 25
25 -
 26
26 -
 27
27 -
 28
28 -
 29
29 -
 30
30 -
 31
31 -
 32
32 -
 33
33 -
 34
34 -
 35
35 -
 36
36 -
 37
37 -
 38
38 -
 39
39 -
 40
40 -
41
-
42
-
43
-
44
-
45
-
46
-
47
-
48
-
49
-
50
-
51
-
52
-
53
-
54
-
55
-
56
-
57
-
58
-
59
-
60
-
61
-
62
-
63
-
64
-
65
-
66
-
67
-
68
-
69
-
70
-
71
-
72
-
73
-
74
-
75
-
76
-
77
-
78
-
79
-
80
-
81
-
82
-
83
-
84
-
85
-
86
-
87
-
88
-
89
-
90
-
91
 |
 |

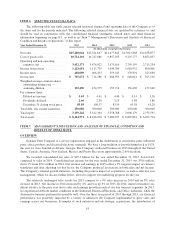
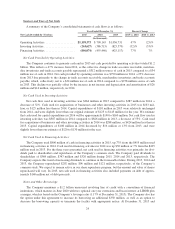
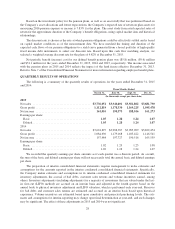
Sources and Uses of Net Cash
A summary of the Company’s consolidated statements of cash flows is as follows:
Year Ended December 31, Percent Change
Net Cash Provided by (Used in): 2015 2014 2013 2015 vs. 2014 2014 vs. 2013
(In thousands)
Operating Activities .................... $1,159,373 $ 790,145 $1,056,731 47% (25)%
Investing Activities ..................... (263,627) (386,715) (825,579) (32)% (53)%
Financing Activities .................... (806,074) (455,440) (425,117) 77% 7%
Net Cash Provided by Operating Activities:
The Company continues to generate cash and in 2015 net cash provided by operating activities totaled $1.2
billion. This reflects a 47% increase from 2014, as the collective change in trade accounts receivable, merchan-
dise inventories and trade accounts payable represented a $312 million source of cash in 2015 compared to a $34
million use of cash in 2014. Net cash provided by operating activities was $790 million in 2014, a 25% decrease
from 2013 due primarily to the change in trade accounts receivable, merchandise inventories and trade accounts
payable, which, collectively, net to a $34 million use of cash in 2014 compared to a $278 million source of cash
in 2013. This decline was partially offset by the increase in net income and depreciation and amortization of $26
million and $14 million, respectively, in 2014.
Net Cash Used in Investing Activities:
Net cash flow used in investing activities was $264 million in 2015 compared to $387 million in 2014, a
decrease of 32%. Cash used for acquisitions of businesses and other investing activities in 2015 was $163 mil-
lion, or $125 million less than in 2014. Capital expenditures of $110 million in 2015 were relatively unchanged
from 2014, and were slightly lower than our original estimate of $125 to $145 million for the year. We estimate
that cash used for capital expenditures in 2016 will be approximately $140 to $160 million. Net cash flow used in
investing activities was $387 million in 2014 compared to $826 million in 2013, a decrease of 53%. Cash used
for acquisitions of businesses and other investing activities in 2014 was $288 million, or $424 million less than in
2013. Capital expenditures of $108 million in 2014 decreased by $16 million or 13% from 2013, and were
slightly lower than our estimate of $120 to $130 million for the year.
Net Cash Used in Financing Activities:
The Company used $806 million of cash in financing activities in 2015, up 77% from the $455 million used
in financing activities in 2014. Cash used in financing activities in 2014 was up $30 million or 7% from the $425
million used in 2013. For the three years presented, net cash used in financing activities was primarily for divi-
dends paid to shareholders and repurchases of the Company’s common stock. The Company paid dividends to
shareholders of $368 million, $347 million and $326 million during 2015, 2014 and 2013, respectively. The
Company expects this trend of increasing dividends to continue in the foreseeable future. During 2015, 2014 and
2013, the Company repurchased $292 million, $96 million and $121 million, respectively, of the Company’s
common stock. We expect to remain active in our share repurchase program, but the amount and value of shares
repurchased will vary. In 2015, net cash used in financing activities also included payments on debt of approx-
imately $140 million net of debt proceeds.
Notes and Other Borrowings
The Company maintains a $1.2 billion unsecured revolving line of credit with a consortium of financial
institutions, which matures in June 2020 with two optional one year extensions and bears interest at LIBOR plus
a margin, which is based on the Company’s leverage ratio (1.17% at December 31, 2015). The Company also has
the option under this agreement to increase its borrowing an additional $350 million, as well as an option to
decrease the borrowing capacity or terminate the facility with appropriate notice. At December 31, 2015 and
24