Napa Auto Parts 2015 Annual Report Download - page 73
Download and view the complete annual report
Please find page 73 of the 2015 Napa Auto Parts annual report below. You can navigate through the pages in the report by either clicking on the pages listed below, or by using the keyword search tool below to find specific information within the annual report.-
 1
1 -
2
-
3
-
4
-
5
-
6
-
7
-
8
-
9
-
10
-
11
-
12
-
13
-
14
-
15
-
16
-
17
-
18
-
19
-
20
-
21
-
22
-
23
-
24
-
25
-
26
-
27
-
28
-
29
-
30
-
31
-
32
-
33
-
34
-
35
-
36
-
37
-
38
-
39
-
40
-
41
-
42
-
43
-
44
-
45
-
46
-
47
-
48
-
49
-
50
-
51
-
52
-
53
-
54
-
55
-
56
-
57
-
58
-
59
-
60
-
61
-
62
-
 63
63 -
 64
64 -
 65
65 -
 66
66 -
 67
67 -
 68
68 -
 69
69 -
 70
70 -
 71
71 -
 72
72 -
 73
73 -
 74
74 -
 75
75 -
 76
76 -
 77
77 -
 78
78 -
 79
79 -
 80
80 -
 81
81 -
 82
82 -
 83
83 -
84
-
85
-
86
-
87
-
88
-
89
-
90
-
91
 |
 |
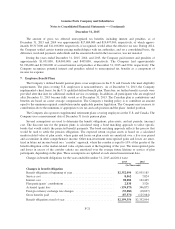
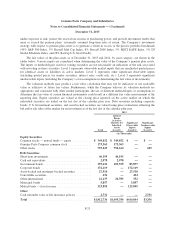
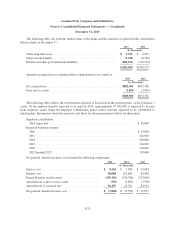
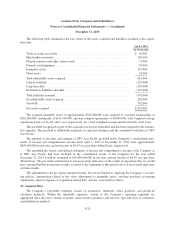
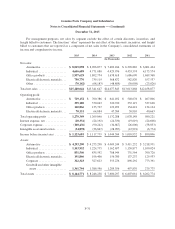
Genuine Parts Company and Subsidiaries
Notes to Consolidated Financial Statements — (Continued)
December 31, 2015
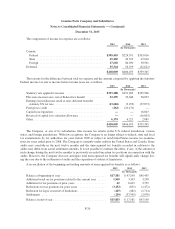
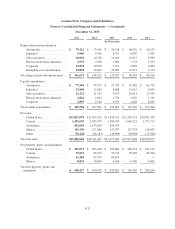
The Company’s automotive segment distributes replacement parts (other than body parts) for substantially
all makes and models of automobiles, trucks, and other vehicles.
The Company’s industrial segment distributes a wide variety of industrial bearings, mechanical and fluid
power transmission equipment, including hydraulic and pneumatic products, material handling components, and
related parts and supplies.
The Company’s office products segment distributes a wide variety of office products, computer supplies,
office furniture, and business electronics.
The Company’s electrical/electronic materials segment distributes a wide variety of electrical/electronic
materials, including insulating and conductive materials for use in electronic and electrical apparatus.
Inter-segment sales are not significant. Operating profit for each industry segment is calculated as net sales
less operating expenses excluding general corporate expenses, interest expense, and equity in income from
investees, amortization, and noncontrolling interests. Approximately $118,800,000, $138,900,000 and
$193,400,000 of income before income taxes was generated in jurisdictions outside the United States for the
years ended December 31, 2015, 2014, and 2013, respectively. Net sales and net property, plant and equipment
by country relate directly to the Company’s operations in the respective country. Corporate assets are principally
cash and cash equivalents and headquarters’ facilities and equipment.
F-30