Napa Auto Parts 2015 Annual Report Download - page 60
Download and view the complete annual report
Please find page 60 of the 2015 Napa Auto Parts annual report below. You can navigate through the pages in the report by either clicking on the pages listed below, or by using the keyword search tool below to find specific information within the annual report.-
 1
1 -
2
-
3
-
4
-
5
-
6
-
7
-
8
-
9
-
10
-
11
-
12
-
13
-
14
-
15
-
16
-
17
-
18
-
19
-
20
-
21
-
22
-
23
-
24
-
25
-
26
-
27
-
28
-
29
-
30
-
31
-
32
-
33
-
34
-
35
-
36
-
37
-
38
-
39
-
40
-
41
-
42
-
43
-
44
-
45
-
46
-
47
-
48
-
49
-
 50
50 -
 51
51 -
 52
52 -
 53
53 -
 54
54 -
 55
55 -
 56
56 -
 57
57 -
 58
58 -
 59
59 -
 60
60 -
 61
61 -
 62
62 -
 63
63 -
 64
64 -
 65
65 -
 66
66 -
 67
67 -
 68
68 -
 69
69 -
 70
70 -
71
-
72
-
73
-
74
-
75
-
76
-
77
-
78
-
79
-
80
-
81
-
82
-
83
-
84
-
85
-
86
-
87
-
88
-
89
-
90
-
91
 |
 |

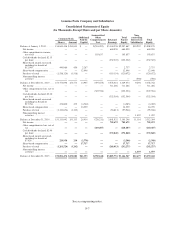
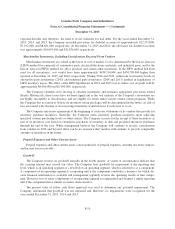
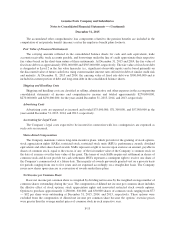
Genuine Parts Company and Subsidiaries
Notes to Consolidated Financial Statements — (Continued)
December 31, 2015
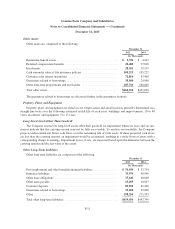
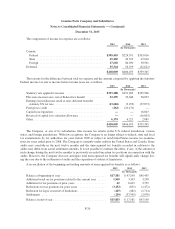
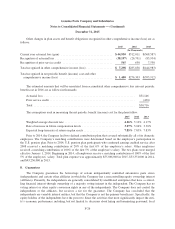
4. Leased Properties
Future minimum payments, by year and in the aggregate, under the noncancelable operating leases with ini-
tial or remaining terms of one year or more was approximately the following at December 31, 2015 (in
thousands):
2016 .................................................................... $207,800
2017 .................................................................... 163,100
2018 .................................................................... 118,300
2019 .................................................................... 78,000
2020 .................................................................... 48,400
Thereafter ................................................................ 152,300
Total minimum lease payments ............................................... $767,900
Rental expense for operating leases was approximately $254,000,000, $233,000,000, and $208,000,000 for
2015, 2014, and 2013, respectively.
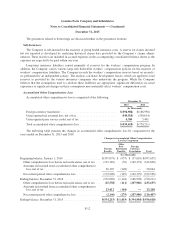
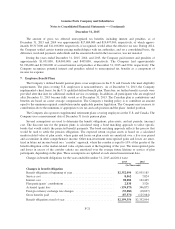
5. Share-Based Compensation
At December 31, 2015, total compensation cost related to nonvested awards not yet recognized was approx-
imately $33,000,000. The weighted-average period over which this compensation cost is expected to be recog-
nized is approximately three years. The aggregate intrinsic value for SARs and RSUs outstanding at
December 31, 2015 and 2014 was approximately $104,000,000 and $198,100,000, respectively. The aggregate
intrinsic value for SARs and RSUs vested totaled approximately $65,000,000 and $116,200,000 at December 31,
2015 and 2014, respectively. At December 31, 2015, the weighted-average contractual life for outstanding and
exercisable SARs and RSUs was six and five years, respectively. Share-based compensation costs of
$17,717,000, $16,239,000, and $12,648,000, were recorded for the years ended December 31, 2015, 2014, and
2013, respectively. The total income tax benefits recognized in the consolidated statements of income and com-
prehensive income for share-based compensation arrangements were approximately $7,100,000, $6,500,000, and
$5,100,000 for 2015, 2014, and 2013, respectively. There have been no modifications to valuation methodologies
or methods during the years ended December 31, 2015, 2014, or 2013.
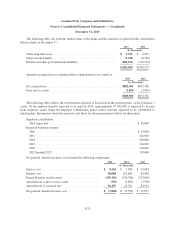
For the years ended December 31, 2015, 2014, and 2013, the fair values for SARs granted were estimated
using a Black-Scholes option pricing model with the following weighted-average assumptions, respectively: risk-
free interest rate of 2.0%, 2.8%, and 2.0%; dividend yield of 2.6%, 2.8%, and 3.2%; annual historical volatility
factor of the expected market price of the Company’s common stock of 19% for each of the three years; an aver-
age expected life and estimated turnover based on the historical pattern of existing grants of approximately seven
years and 5.4%, respectively. The fair value of RSUs is based on the price of the Company’s stock on the date of
grant. The total fair value of shares vested during the years ended December 31, 2015, 2014, and 2013 were
$15,200,000, $13,800,000, and $8,100,000, respectively.
F-17