Napa Auto Parts 2015 Annual Report Download - page 65
Download and view the complete annual report
Please find page 65 of the 2015 Napa Auto Parts annual report below. You can navigate through the pages in the report by either clicking on the pages listed below, or by using the keyword search tool below to find specific information within the annual report.-
 1
1 -
2
-
3
-
4
-
5
-
6
-
7
-
8
-
9
-
10
-
11
-
12
-
13
-
14
-
15
-
16
-
17
-
18
-
19
-
20
-
21
-
22
-
23
-
24
-
25
-
26
-
27
-
28
-
29
-
30
-
31
-
32
-
33
-
34
-
35
-
36
-
37
-
38
-
39
-
40
-
41
-
42
-
43
-
44
-
45
-
46
-
47
-
48
-
49
-
50
-
51
-
52
-
53
-
54
-
 55
55 -
 56
56 -
 57
57 -
 58
58 -
 59
59 -
 60
60 -
 61
61 -
 62
62 -
 63
63 -
 64
64 -
 65
65 -
 66
66 -
 67
67 -
 68
68 -
 69
69 -
 70
70 -
 71
71 -
 72
72 -
 73
73 -
 74
74 -
 75
75 -
76
-
77
-
78
-
79
-
80
-
81
-
82
-
83
-
84
-
85
-
86
-
87
-
88
-
89
-
90
-
91
 |
 |

Genuine Parts Company and Subsidiaries
Notes to Consolidated Financial Statements — (Continued)
December 31, 2015
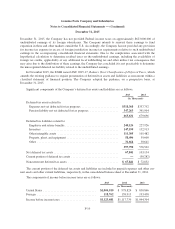
The actuarial loss incurred in the year ended December 31, 2014 is primarily attributable to a lower discount
rate, as well as changes in the mortality assumptions.
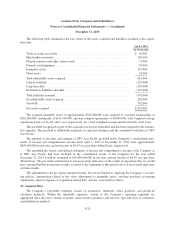
The benefit obligations for the Company’s U.S. pension plans included in the above were $2,012,935,000
and $2,135,827,000 at December 31, 2015 and 2014, respectively. The total accumulated benefit obligation for
the Company’s defined benefit pension plans in the U.S. and Canada was approximately $2,179,626,000 and
$2,328,489,000 at December 31, 2015 and 2014, respectively.
The assumptions used to measure the pension benefit obligations for the plans at December 31, 2015 and
2014, were:
2015 2014
Weighted-average discount rate ............................................ 4.82% 4.26%
Rate of increase in future compensation levels ................................. 3.12% 3.07%
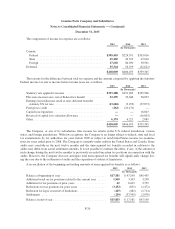
Changes in plan assets for the years ended December 31, 2015 and 2014 were:
2015 2014
(In Thousands)
Changes in plan assets
Fair value of plan assets at beginning of year ................................. $2,021,837 $1,933,063
Actual return on plan assets .............................................. (45,529) 174,652
Foreign currency exchange rate changes .................................... (33,382) (17,616)
Employer contributions .................................................. 54,543 53,296
Plan participants’ contributions ............................................ 2,838 3,526
Benefits paid .......................................................... (87,571) (125,084)
Fair value of plan assets at end of year ...................................... $1,912,736 $2,021,837
The fair values of plan assets for the Company’s U.S. pension plans included in the above were
$1,731,368,000 and $1,819,747,000 at December 31, 2015 and 2014, respectively.
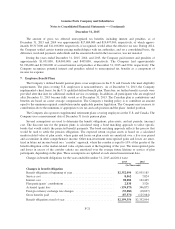
The asset allocations for the Company’s funded pension plans at December 31, 2015 and 2014, and the tar-
get allocation for 2016, by asset category were:
Target
Allocation
2016
Percentage of
Plan Assets at
December 31
2015 2014
Asset Category
Equity securities ......................................................... 71% 69% 70%
Debt securities .......................................................... 29% 31% 30%
100% 100% 100%
The Company’s benefit plan committees in the U.S. and Canada establish investment policies and strategies
and regularly monitor the performance of the funds. The pension plan strategy implemented by the Company’s
management is to achieve long-term objectives and invest the pension assets in accordance with the applicable
pension legislation in the U.S. and Canada, as well as fiduciary standards. The long-term primary investment
objectives for the pension plans are to provide for a reasonable amount of long-term growth of capital, without
F-22