Napa Auto Parts 2015 Annual Report Download - page 61
Download and view the complete annual report
Please find page 61 of the 2015 Napa Auto Parts annual report below. You can navigate through the pages in the report by either clicking on the pages listed below, or by using the keyword search tool below to find specific information within the annual report.-
 1
1 -
2
-
3
-
4
-
5
-
6
-
7
-
8
-
9
-
10
-
11
-
12
-
13
-
14
-
15
-
16
-
17
-
18
-
19
-
20
-
21
-
22
-
23
-
24
-
25
-
26
-
27
-
28
-
29
-
30
-
31
-
32
-
33
-
34
-
35
-
36
-
37
-
38
-
39
-
40
-
41
-
42
-
43
-
44
-
45
-
46
-
47
-
48
-
49
-
50
-
 51
51 -
 52
52 -
 53
53 -
 54
54 -
 55
55 -
 56
56 -
 57
57 -
 58
58 -
 59
59 -
 60
60 -
 61
61 -
 62
62 -
 63
63 -
 64
64 -
 65
65 -
 66
66 -
 67
67 -
 68
68 -
 69
69 -
 70
70 -
 71
71 -
72
-
73
-
74
-
75
-
76
-
77
-
78
-
79
-
80
-
81
-
82
-
83
-
84
-
85
-
86
-
87
-
88
-
89
-
90
-
91
 |
 |

Genuine Parts Company and Subsidiaries
Notes to Consolidated Financial Statements — (Continued)
December 31, 2015
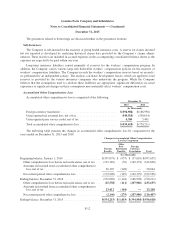
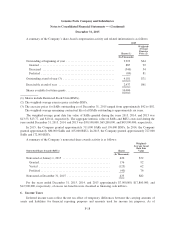
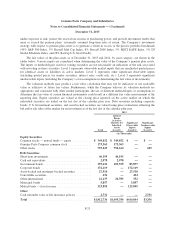
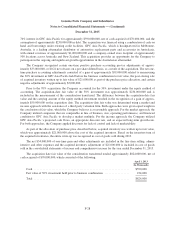
A summary of the Company’s share-based compensation activity and related information is as follows:
2015
Shares (1)
Weighted-
Average
Exercise
Price (2)
(In Thousands)
Outstanding at beginning of year ................................. 3,923 $64
Granted ................................................... 887 92
Exercised ................................................. (540) 54
Forfeited .................................................. (89) 81
Outstanding at end of year (3) ................................... 4,181 $71
Exercisable at end of year ...................................... 2,437 $61
Shares available for future grants ................................. 10,000
(1) Shares include Restricted Stock Units (RSUs).
(2) The weighted-average exercise price excludes RSUs.
(3) The exercise prices for SARs outstanding as of December 31, 2015 ranged from approximately $42 to $92.
The weighted-average remaining contractual life of all SARs outstanding is approximately six years.
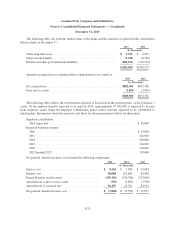
The weighted-average grant date fair value of SARs granted during the years 2015, 2014, and 2013 was
$13.53, $13.77, and $10.14, respectively. The aggregate intrinsic value of SARs and RSUs exercised during the
years ended December 31, 2015, 2014, and 2013 was $30,100,000, $65,200,000, and $43,900,000, respectively.
In 2015, the Company granted approximately 711,000 SARs and 176,000 RSUs. In 2014, the Company
granted approximately 680,000 SARs and 165,000 RSUs. In 2013, the Company granted approximately 727,000
SARs and 172,000 RSUs.
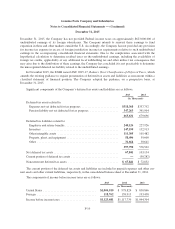
A summary of the Company’s nonvested share awards activity is as follows:
Nonvested Share Awards (RSUs) Shares
Weighted-
Average Grant
Date Fair
Value
(In Thousands)
Nonvested at January 1, 2015 ................................ 420 $72
Granted ................................................ 176 92
Vested ................................................ (123) 62
Forfeited ............................................... (40) 76
Nonvested at December 31, 2015 ............................. 433 $82
For the years ended December 31, 2015, 2014, and 2013 approximately $7,000,000, $17,800,000, and
$12,900,000, respectively, of excess tax benefits were classified as financing cash inflows.
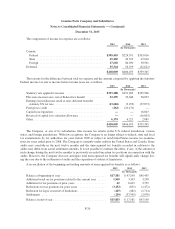
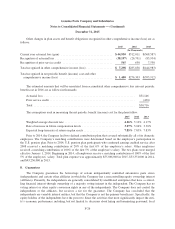
6. Income Taxes
Deferred income taxes reflect the net tax effect of temporary differences between the carrying amounts of
assets and liabilities for financial reporting purposes and amounts used for income tax purposes. As of
F-18