Napa Auto Parts 2015 Annual Report Download - page 66
Download and view the complete annual report
Please find page 66 of the 2015 Napa Auto Parts annual report below. You can navigate through the pages in the report by either clicking on the pages listed below, or by using the keyword search tool below to find specific information within the annual report.-
 1
1 -
2
-
3
-
4
-
5
-
6
-
7
-
8
-
9
-
10
-
11
-
12
-
13
-
14
-
15
-
16
-
17
-
18
-
19
-
20
-
21
-
22
-
23
-
24
-
25
-
26
-
27
-
28
-
29
-
30
-
31
-
32
-
33
-
34
-
35
-
36
-
37
-
38
-
39
-
40
-
41
-
42
-
43
-
44
-
45
-
46
-
47
-
48
-
49
-
50
-
51
-
52
-
53
-
54
-
55
-
 56
56 -
 57
57 -
 58
58 -
 59
59 -
 60
60 -
 61
61 -
 62
62 -
 63
63 -
 64
64 -
 65
65 -
 66
66 -
 67
67 -
 68
68 -
 69
69 -
 70
70 -
 71
71 -
 72
72 -
 73
73 -
 74
74 -
 75
75 -
 76
76 -
77
-
78
-
79
-
80
-
81
-
82
-
83
-
84
-
85
-
86
-
87
-
88
-
89
-
90
-
91
 |
 |

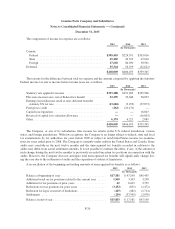
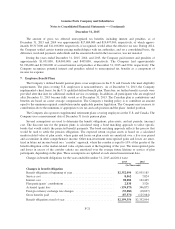
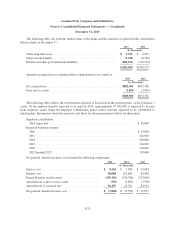
Genuine Parts Company and Subsidiaries
Notes to Consolidated Financial Statements — (Continued)
December 31, 2015
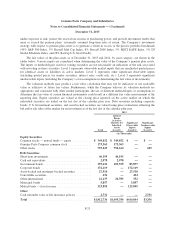
undue exposure to risk, protect the assets from erosion of purchasing power, and provide investment results that
meet or exceed the pension plans’ actuarially assumed long-term rates of return. The Company’s investment
strategy with respect to pension plan assets is to generate a return in excess of the passive portfolio benchmark
(49% S&P 500 Index, 5% Russell Mid Cap Index, 8% Russell 2000 Index, 5% MSCI EAFE Index, 5% DJ
Global Moderate Index, and 28% BarCap U.S. Govt/Credit).
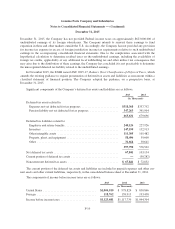
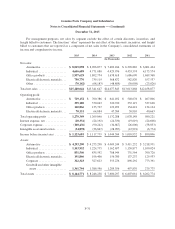
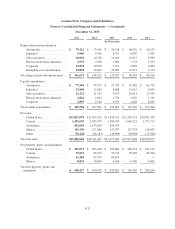
The fair values of the plan assets as of December 31, 2015 and 2014, by asset category, are shown in the
tables below. Various inputs are considered when determining the value of the Company’s pension plan assets.
The inputs or methodologies used for valuing securities are not necessarily an indication of the risk associated
with investing in these securities. Level 1 represents observable market inputs that are unadjusted quoted prices
for identical assets or liabilities in active markets. Level 2 represents other significant observable inputs
(including quoted prices for similar securities, interest rates, credit risk, etc.). Level 3 represents significant
unobservable inputs (including the Company’s own assumptions in determining the fair value of investments).
The valuation methods may produce a fair value calculation that may not be indicative of net realizable
value or reflective of future fair values. Furthermore, while the Company believes its valuation methods are
appropriate and consistent with other market participants, the use of different methodologies or assumptions to
determine the fair value of certain financial instruments could result in a different fair value measurement at the
reporting date. Equity securities are valued at the closing price reported on the active market on which the
individual securities are traded on the last day of the calendar plan year. Debt securities including corporate
bonds, U.S. Government securities, and asset-backed securities are valued using price evaluations reflecting the
bid and/or ask sides of the market for an investment as of the last day of the calendar plan year.
2015
Total
Quoted
Prices
in Active
Markets for
Identical
Assets
(Level 1)
Significant
Observable
Inputs
(Level 2)
Significant
Unobservable
Inputs
(Level 3)
(In Thousands)
Equity Securities
Common stocks — mutual funds — equity ............. $ 349,852 $ 349,852 $ — $ —
Genuine Parts Company common stock ................ 173,363 173,363 — —
Other stocks ..................................... 793,229 792,624 — 605
Debt Securities
Short-term investments ............................. 46,195 46,195 — —
Cash and equivalents .............................. 2,978 2,978 — —
Government bonds ................................ 193,436 109,559 83,877 —
Corporate bonds .................................. 172,119 — 172,119 —
Asset-backed and mortgage–backed securities .......... 27,510 — 27,510 —
Convertible securities .............................. 434 — 434 —
Other-international ................................ 21,137 20,785 352 —
Municipal bonds .................................. 5,857 — 5,857 —
Mutual funds — fixed income ....................... 123,895 — 123,895 —
Other
Cash surrender value of life insurance policies .......... 2,731 — — 2,731
Total ........................................... $1,912,736 $1,495,356 $414,044 $3,336
F-23