Napa Auto Parts 2015 Annual Report Download - page 24
Download and view the complete annual report
Please find page 24 of the 2015 Napa Auto Parts annual report below. You can navigate through the pages in the report by either clicking on the pages listed below, or by using the keyword search tool below to find specific information within the annual report.-
 1
1 -
2
-
3
-
4
-
5
-
6
-
7
-
8
-
9
-
10
-
11
-
12
-
13
-
 14
14 -
 15
15 -
 16
16 -
 17
17 -
 18
18 -
 19
19 -
 20
20 -
 21
21 -
 22
22 -
 23
23 -
 24
24 -
 25
25 -
 26
26 -
 27
27 -
 28
28 -
 29
29 -
 30
30 -
 31
31 -
 32
32 -
 33
33 -
 34
34 -
35
-
36
-
37
-
38
-
39
-
40
-
41
-
42
-
43
-
44
-
45
-
46
-
47
-
48
-
49
-
50
-
51
-
52
-
53
-
54
-
55
-
56
-
57
-
58
-
59
-
60
-
61
-
62
-
63
-
64
-
65
-
66
-
67
-
68
-
69
-
70
-
71
-
72
-
73
-
74
-
75
-
76
-
77
-
78
-
79
-
80
-
81
-
82
-
83
-
84
-
85
-
86
-
87
-
88
-
89
-
90
-
91
 |
 |

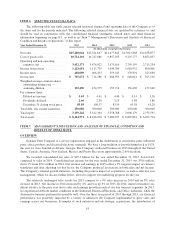
ITEM 6. SELECTED FINANCIAL DATA.
The following table sets forth certain selected historical financial and operating data of the Company as of
the dates and for the periods indicated. The following selected financial data are qualified by reference to, and
should be read in conjunction with, the consolidated financial statements, related notes and other financial
information beginning on page F-1, as well as in “Item 7. Management’s Discussion and Analysis of Financial
Condition and Results of Operations” of this report.
Year Ended December 31, 2015 2014 2013 2012 2011
(In thousands, except per share data)
Net sales ....................... $15,280,044 $15,341,647 $14,077,843 $13,013,868 $12,458,877
Cost of goods sold ................ 10,724,192 10,747,886 9,857,923 9,235,777 8,852,837
Operating and non-operating
expenses, net .................. 3,432,171 3,476,022 3,175,616 2,759,159 2,715,234
Income before taxes .............. 1,123,681 1,117,739 1,044,304 1,018,932 890,806
Income taxes .................... 418,009 406,453 359,345 370,891 325,690
Net income ..................... $ 705,672 $ 711,286 $ 684,959 $ 648,041 $ 565,116
Weighted average common shares
outstanding during year —
assuming dilution .............. 152,496 154,375 155,714 156,420 157,660
Per common share:
Diluted net income ............. $ 4.63 $ 4.61 $ 4.40 $ 4.14 $ 3.58
Dividends declared ............. 2.46 2.30 2.15 1.98 1.80
December 31 closing stock price . . 85.89 106.57 83.19 63.58 61.20
Total debt, less current maturities .... 250,000 500,000 500,000 250,000 500,000
Total equity ..................... 3,159,242 3,312,364 3,358,768 3,008,179 2,753,591
Total assets ..................... $ 8,144,771 $ 8,246,238 $ 7,680,297 $ 6,807,061 $ 6,202,774
ITEM 7. MANAGEMENT’S DISCUSSION AND ANALYSIS OF FINANCIAL CONDITION AND
RESULTS OF OPERATIONS.
OVERVIEW
Genuine Parts Company is a service organization engaged in the distribution of automotive parts, industrial
parts, office products and electrical/electronic materials. We have a long tradition of growth dating back to 1928,
the year we were founded in Atlanta, Georgia. The Company conducted business in 2015 throughout the United
States, Canada, Australia, New Zealand, Mexico and Puerto Rico from approximately 2,650 locations.
We recorded consolidated net sales of $15.3 billion for the year ended December 31, 2015, down 0.4%
compared to sales in 2014. Consolidated net income for the year ended December 31, 2015 was $706 million,
down 1% from $711 million in 2014. Our revenue and earnings in 2015 reflect a 3% negative impact of currency
translation and after adjusting for this factor, the Company produced an increase in both sales and net income.
The Company’s internal growth initiatives, including the positive impact of acquisitions, as well as effective cost
management, which we discuss further below, served to support our underlying progress for the year.
The relatively unchanged sales results for 2015 compare to a 9% sales increase in 2014 and an 8% sales
increase in 2013. Net income in 2014 increased by 4% and was up 6% in 2013. In 2014, improved market con-
ditions relative to the prior year drove sales and earnings growth in each of our four business segments. In 2013,
we experienced difficult market conditions in the Industrial, Electrical/Electronic and Office industries, while the
Automotive business performed reasonably well. Over the three year period of 2013 through 2015, our financial
performance was positively impacted by a variety of initiatives the Company implemented to grow sales and
earnings across our businesses. Examples of such initiatives include strategic acquisitions, the introduction of
18