Napa Auto Parts 2015 Annual Report Download - page 50
Download and view the complete annual report
Please find page 50 of the 2015 Napa Auto Parts annual report below. You can navigate through the pages in the report by either clicking on the pages listed below, or by using the keyword search tool below to find specific information within the annual report.-
 1
1 -
2
-
3
-
4
-
5
-
6
-
7
-
8
-
9
-
10
-
11
-
12
-
13
-
14
-
15
-
16
-
17
-
18
-
19
-
20
-
21
-
22
-
23
-
24
-
25
-
26
-
27
-
28
-
29
-
30
-
31
-
32
-
33
-
34
-
35
-
36
-
37
-
38
-
39
-
 40
40 -
 41
41 -
 42
42 -
 43
43 -
 44
44 -
 45
45 -
 46
46 -
 47
47 -
 48
48 -
 49
49 -
 50
50 -
 51
51 -
 52
52 -
 53
53 -
 54
54 -
 55
55 -
 56
56 -
 57
57 -
 58
58 -
 59
59 -
 60
60 -
61
-
62
-
63
-
64
-
65
-
66
-
67
-
68
-
69
-
70
-
71
-
72
-
73
-
74
-
75
-
76
-
77
-
78
-
79
-
80
-
81
-
82
-
83
-
84
-
85
-
86
-
87
-
88
-
89
-
90
-
91
 |
 |

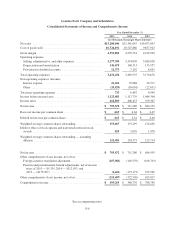
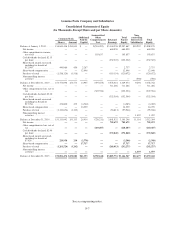
Genuine Parts Company and Subsidiaries
Consolidated Statements of Equity
(In Thousands, Except Share and per Share Amounts)
Common Stock Additional
Paid-In
Capital
Accumulated
Other
Comprehensive
Loss
Retained
Earnings
Total
Parent
Equity
Non-
controlling
Interests in
Subsidiaries
Total
EquityShares Amount
Balance at January 1, 2013 ....... 154,841,438 $154,841 $ — $(501,492) $3,344,538 $2,997,887 $10,292 $3,008,179
Net income ................. — — — — 684,959 684,959 — 684,959
Other comprehensive income,
netoftax................. — — — 103,837 — 103,837 — 103,837
Cash dividends declared, $2.15
per share ................. — — — — (332,322) (332,322) — (332,322)
Share-based awards exercised,
including tax benefit of
$12,905 .................. 449,986 450 2,287 — — 2,737 — 2,737
Share-based compensation ..... — — 12,648 — — 12,648 — 12,648
Purchase of stock ............ (1,518,326) (1,518) — — (119,154) (120,672) — (120,672)
Noncontrolling interest
activities ................. — — — — — — (598) (598)
Balance at December 31, 2013 .... 153,773,098 153,773 14,935 (397,655) 3,578,021 3,349,074 9,694 3,358,768
Net income ................. — — — — 711,286 711,286 — 711,286
Other comprehensive loss, net of
tax...................... — — — (322,556) — (322,556) — (322,556)
Cash dividends declared, $2.30
per share ................. — — — — (352,564) (352,564) — (352,564)
Share-based awards exercised,
including tax benefit of
$17,766 .................. 474,800 475 (4,760) — — (4,285) — (4,285)
Share-based compensation ..... — — 16,239 — — 16,239 — 16,239
Purchase of stock ............ (1,134,856) (1,135) — — (94,811) (95,946) — (95,946)
Noncontrolling interest
activities ................. — — — — — — 1,422 1,422
Balance at December 31, 2014 .... 153,113,042 153,113 26,414 (720,211) 3,841,932 3,301,248 11,116 3,312,364
Net income ................. — — — — 705,672 705,672 — 705,672
Other comprehensive loss, net of
tax...................... — — — (210,407) — (210,407) — (210,407)
Cash dividends declared, $2.46
per share ................. — — — — (372,840) (372,840) — (372,840)
Share-based awards exercised,
including tax benefit of
$7,024 ................... 229,958 230 (2,778) — — (2,548) — (2,548)
Share-based compensation ..... — — 17,717 — — 17,717 — 17,717
Purchase of stock ............ (3,261,526) (3,262) — — (289,013) (292,275) — (292,275)
Noncontrolling interest
activities ................. — — — — — — 1,559 1,559
Balance at December 31, 2015 .... 150,081,474 $150,081 $41,353 $(930,618) $3,885,751 $3,146,567 $12,675 $3,159,242
See accompanying notes.
F-7