Napa Auto Parts 2015 Annual Report Download - page 3
Download and view the complete annual report
Please find page 3 of the 2015 Napa Auto Parts annual report below. You can navigate through the pages in the report by either clicking on the pages listed below, or by using the keyword search tool below to find specific information within the annual report.-
 1
1 -
 2
2 -
 3
3 -
 4
4 -
 5
5 -
 6
6 -
 7
7 -
 8
8 -
 9
9 -
 10
10 -
 11
11 -
 12
12 -
 13
13 -
 14
14 -
15
-
16
-
17
-
18
-
19
-
20
-
21
-
22
-
23
-
24
-
25
-
26
-
27
-
28
-
29
-
30
-
31
-
32
-
33
-
34
-
35
-
36
-
37
-
38
-
39
-
40
-
41
-
42
-
43
-
44
-
45
-
46
-
47
-
48
-
49
-
50
-
51
-
52
-
53
-
54
-
55
-
56
-
57
-
58
-
59
-
60
-
61
-
62
-
63
-
64
-
65
-
66
-
67
-
68
-
69
-
70
-
71
-
72
-
73
-
74
-
75
-
76
-
77
-
78
-
79
-
80
-
81
-
82
-
83
-
84
-
85
-
86
-
87
-
88
-
89
-
90
-
91
 |
 |
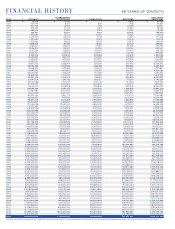
2015 Increase 2014 Increase 2013
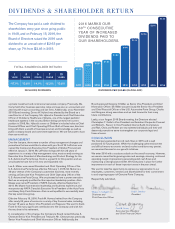
Net Sales $ 15,280,044,000 -0.4% $ 15,341,647,000 9% $ 14,077,843,000
Income Before Taxes 1,123,681,000 1% 1,117,739,000 7% 1,044,304,000
Income Taxes 418,009,000 3% 406,453,000 13% 359,345,000
Net Income 705,672,000 -1% 711,286,000 4% 684,959,000
Shareholders’ Equity 3,159,242,000 -5% 3,312,364,000 -1% 3,358,768,000
Rate Earned on Shareholders’ Equity 21.3% - 21.2% - 22.8%
at the Beginning of the Year
Average Common Shares 152,496,000 - 154,375,000 - 155,714,000
Outstanding-Assuming Dilution
PER COMMON SHARE:
Diluted Net Income $4.63 0.4% $4.61 5% $4.40
Dividends Declared $2.46 7% $2.30 7% $2.15
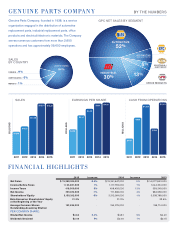
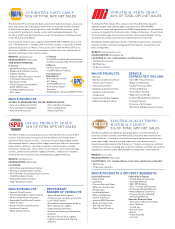
Genuine Parts Company, founded in 1928, is a service
organization engaged in the distribution of automotive
replacement parts, industrial replacement parts, offi ce
products and electrical/electronic materials. The Company
serves numerous customers from more than 2,650
operations and has approximately 39,600 employees.
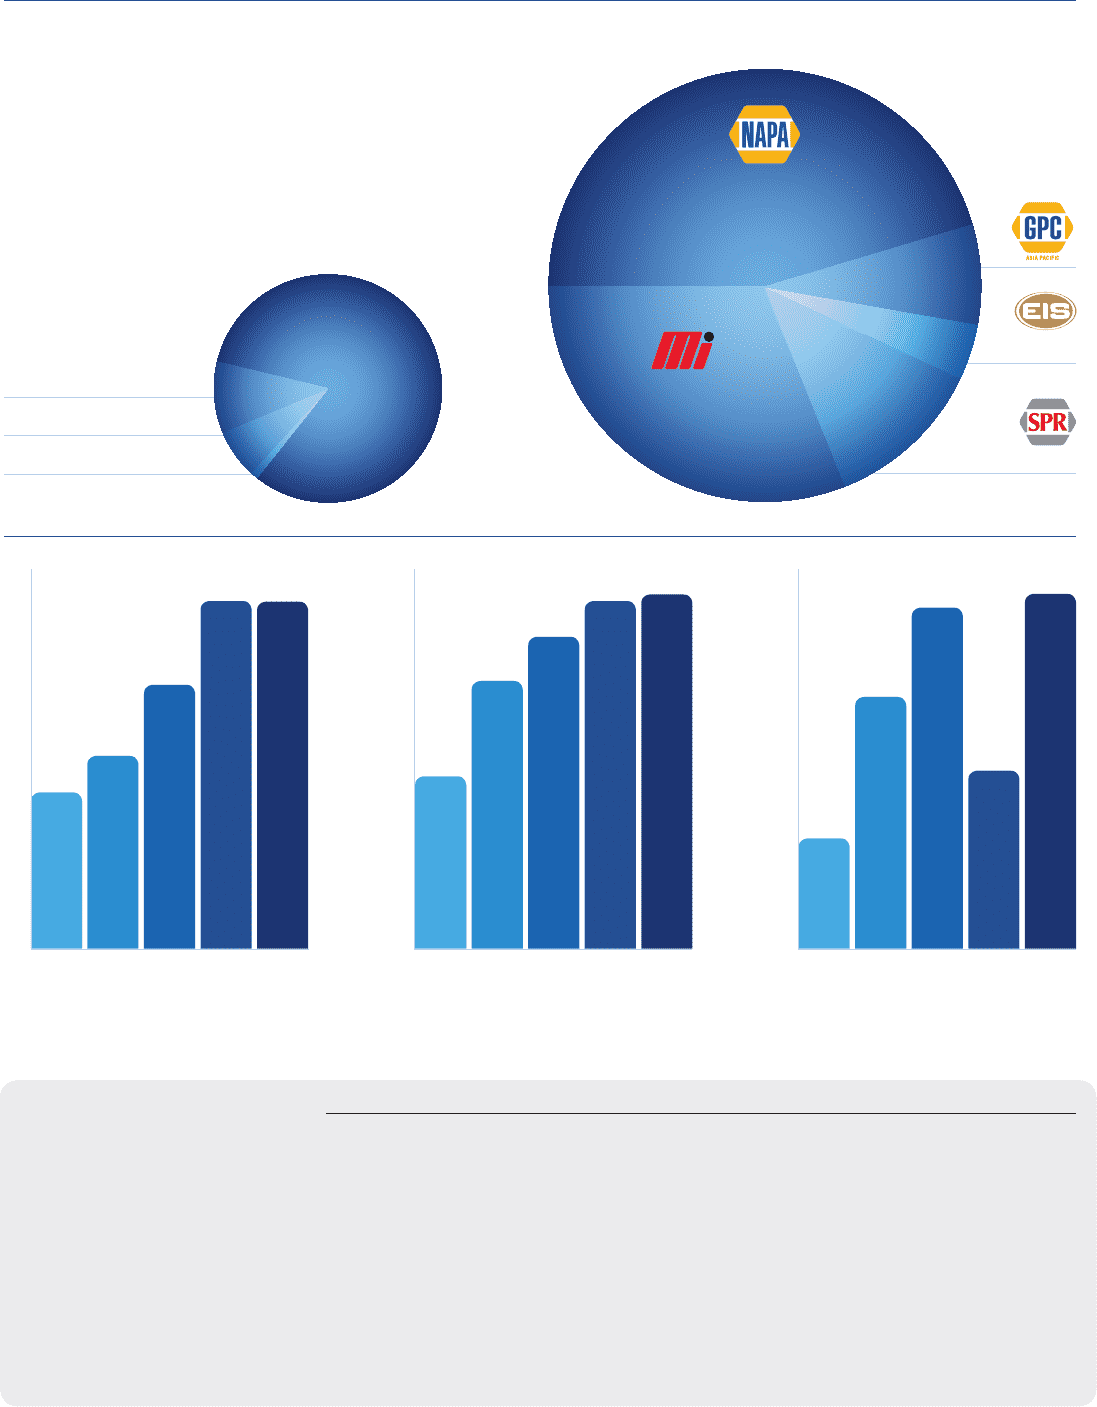
GPC NET SALES BY SEGMENT
GENUINE PARTS COMPANY
FINANCIAL HIGHLIGHTS
BY THE NUMBERS
EARNINGS PER SHARESALES
CASH FROM OPERATIONS
20152011 2012 2013 2014
DOLLARS
$4.40
$4.14
$3.58
$4.63
$4.61
20152011 2012 2013 2014
BILLIONS
$15.34 $15.28
$14.08
$13.01
$12.46
20152011 2012 2013 2014
MILLIONS
$1,057
$906
$625
$1,159
AUTOMOTIVE
52%
30%
5%
AUTOMOTIVE
INDUSTRIAL
AUTOMOTIVE
GPC ASIA PACIFIC
ELECTRICAL/
ELECTRONIC
13%
OFFICE PRODUCTS
SALES
BY COUNTRY
CANADA – 9%
AUSTRALASIA – 6%
MEXICO – 1%
$790
84%
UNITED STATES