Napa Auto Parts 2015 Annual Report Download - page 68
Download and view the complete annual report
Please find page 68 of the 2015 Napa Auto Parts annual report below. You can navigate through the pages in the report by either clicking on the pages listed below, or by using the keyword search tool below to find specific information within the annual report.-
 1
1 -
2
-
3
-
4
-
5
-
6
-
7
-
8
-
9
-
10
-
11
-
12
-
13
-
14
-
15
-
16
-
17
-
18
-
19
-
20
-
21
-
22
-
23
-
24
-
25
-
26
-
27
-
28
-
29
-
30
-
31
-
32
-
33
-
34
-
35
-
36
-
37
-
38
-
39
-
40
-
41
-
42
-
43
-
44
-
45
-
46
-
47
-
48
-
49
-
50
-
51
-
52
-
53
-
54
-
55
-
56
-
57
-
 58
58 -
 59
59 -
 60
60 -
 61
61 -
 62
62 -
 63
63 -
 64
64 -
 65
65 -
 66
66 -
 67
67 -
 68
68 -
 69
69 -
 70
70 -
 71
71 -
 72
72 -
 73
73 -
 74
74 -
 75
75 -
 76
76 -
 77
77 -
 78
78 -
79
-
80
-
81
-
82
-
83
-
84
-
85
-
86
-
87
-
88
-
89
-
90
-
91
 |
 |

Genuine Parts Company and Subsidiaries
Notes to Consolidated Financial Statements — (Continued)
December 31, 2015
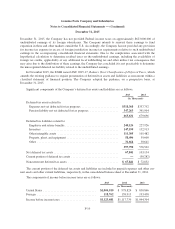
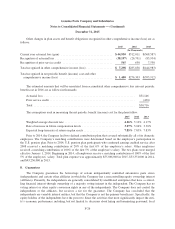
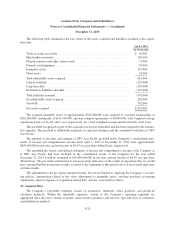
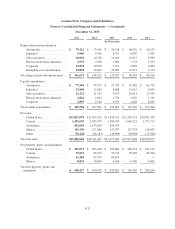
The following table sets forth the funded status of the plans and the amounts recognized in the consolidated
balance sheets at December 31:
2015 2014
(In Thousands)
Other long-term asset ........................................... $ 3,336 $ 4,247
Other current liability ........................................... (7,432) (6,740)
Pension and other post-retirement liabilities ......................... (282,524) (327,764)
$(286,620) $(330,257)
Amounts recognized in accumulated other comprehensive loss consist of:
2015 2014
(In Thousands)
Net actuarial loss ................................................ $882,464 $875,788
Prior service credit .............................................. (1,814) (2,436)
$880,650 $873,352
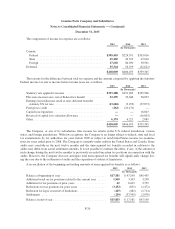
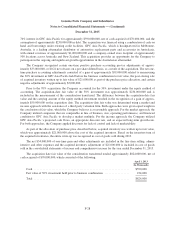
The following table reflects the total benefits expected to be paid from the pension plans’ or the Company’s
assets. Of the pension benefits expected to be paid in 2016, approximately $7,382,000 is expected to be paid
from employer assets. Expected employer contributions below reflect amounts expected to be contributed to
funded plans. Information about the expected cash flows for the pension plans follows (in thousands):
Employer contribution
2016 (expected) ......................................................... $ 49,000
Expected benefit payments:
2016 .................................................................. $ 93,000
2017 .................................................................. 102,000
2018 .................................................................. 109,000
2019 .................................................................. 116,000
2020 .................................................................. 124,000
2021 through 2025 ....................................................... 703,000
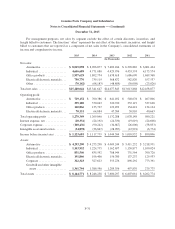
Net periodic benefit (income) cost included the following components:
2015 2014 2013
(In Thousands)
Service cost ....................................... $ 8,562 $ 7,824 $ 19,083
Interest cost ....................................... 98,088 102,465 89,408
Expected return on plan assets ......................... (150,130) (144,746) (133,816)
Amortization of prior service credit ..................... (565) (1,890) (7,538)
Amortization of actuarial loss ......................... 38,197 26,791 83,934
Net periodic benefit (income) cost ...................... $ (5,848) $ (9,556) $ 51,071
F-25