Napa Auto Parts 2015 Annual Report Download - page 27
Download and view the complete annual report
Please find page 27 of the 2015 Napa Auto Parts annual report below. You can navigate through the pages in the report by either clicking on the pages listed below, or by using the keyword search tool below to find specific information within the annual report.-
 1
1 -
2
-
3
-
4
-
5
-
6
-
7
-
8
-
9
-
10
-
11
-
12
-
13
-
14
-
15
-
16
-
 17
17 -
 18
18 -
 19
19 -
 20
20 -
 21
21 -
 22
22 -
 23
23 -
 24
24 -
 25
25 -
 26
26 -
 27
27 -
 28
28 -
 29
29 -
 30
30 -
 31
31 -
 32
32 -
 33
33 -
 34
34 -
 35
35 -
 36
36 -
 37
37 -
38
-
39
-
40
-
41
-
42
-
43
-
44
-
45
-
46
-
47
-
48
-
49
-
50
-
51
-
52
-
53
-
54
-
55
-
56
-
57
-
58
-
59
-
60
-
61
-
62
-
63
-
64
-
65
-
66
-
67
-
68
-
69
-
70
-
71
-
72
-
73
-
74
-
75
-
76
-
77
-
78
-
79
-
80
-
81
-
82
-
83
-
84
-
85
-
86
-
87
-
88
-
89
-
90
-
91
 |
 |
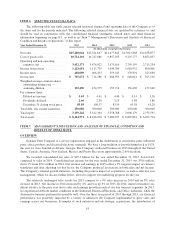
the prior year periods. As this business is dependent on the manufacturing segment of the economy, we expect to
face challenging end market conditions for at least the first half of 2016. To offset the challenges, we have ini-
tiatives in place to generate growth for this business.
Net sales for Electrical/Electronic were $739 million in 2014, an increase of 30% from 2013. The increase
in sales consists of an increase in sales volume of approximately 1% and a 29% sales contribution from acquis-
itions. The benefit of higher transaction values associated with slight price inflation for the year was offset by the
negative sales impact of copper pricing. Sales for Electrical/Electronic increased by 30% in the first quarter, 32%
in the second quarter, 35% in the third quarter and 23% in the fourth quarter.
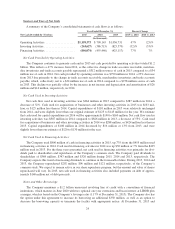
Cost of Goods Sold
The Company includes in cost of goods sold the actual cost of merchandise, which represents the vast
majority of this line item. Other items in cost of goods sold include warranty costs and in-bound freight from the
supplier, net of any vendor allowances and incentives. Cost of goods sold was $10.72 billion in 2015, $10.75 bil-
lion in 2014 and $9.86 billion in 2013. Cost of goods sold in 2015 and 2014 changed from the prior year periods
in accordance with the related percentage change in sales for the same periods. For these periods, product
inflation was relatively insignificant and actual costs were relatively unchanged from the prior year. Cost of
goods sold represented 70.2% of net sales in 2015, 70.1% of net sales in 2014 and 70.0% of net sales in 2013
and, as a percent of net sales, increased slightly in 2015 from 2014 and also in 2014 from 2013.
In 2015, 2014 and 2013, the Industrial and Office business segments experienced slight vendor price
increases. In 2014 and 2013, the Electrical/Electronic business also experienced slight vendor price increases. In
any year where we experience price increases, we are able to work with our customers to pass most of these
along to them.
Operating Expenses
The Company includes in selling, administrative and other expenses (“SG&A”), all personnel and
personnel-related costs at its headquarters, distribution centers, stores and branches, which accounts for approx-
imately 65% of total SG&A. Additional costs in SG&A include our facilities, delivery, marketing, advertising,
legal and professional costs.
SG&A of $3.28 billion in 2015 decreased by $37 million or approximately 1% from 2014. This represents
21.4% of net sales, and compares favorably to 21.6% of net sales in 2014. The decrease in SG&A expenses as a
percentage of net sales from the prior year reflect the positive impact of our cost control measures and our man-
agement teams’ focus on properly managing the Company’s expenses. We also continue to assess the optimal
cost structure in our businesses. Depreciation and amortization expense was $142 million in 2015, a decrease of
approximately $6 million or 4% from 2014. The provision for doubtful accounts was $12 million in 2015, up
from $7 million in 2014. We believe the Company is adequately reserved for bad debts at December 31, 2015.
SG&A increased by $286 million or approximately 9% to $3.31 billion in 2014, representing 21.6% of net
sales, which compares to 21.5% of net sales in 2013. The increase in SG&A expenses as a percentage of net sales
from the prior year primarily reflects the $54 million one-time gain, net of other expense adjustments, recorded
to SG&A in the second quarter of 2013 as a purchase accounting adjustment associated with the April 1, 2013
acquisition of GPC Asia Pacific. Our management teams remain focused on properly managing the Company’s
expenses and continuing to assess the appropriate cost structure in our businesses. Depreciation and amortization
expense was $148 million in 2014, an increase of $14 million or 11% from 2013. This increase relates to higher
depreciation and the amortization associated with acquisitions in both 2014 and 2013. The provision for doubtful
accounts was $7 million in 2014, down from $9 million in 2013.
Total share-based compensation expense for the years ended December 31, 2015, 2014 and 2013 was $17.7
million, $16.2 million and $12.6 million, respectively. Refer to Note 5 of the Consolidated Financial Statements
for further information regarding share-based compensation.
21