Napa Auto Parts 2015 Annual Report Download - page 34
Download and view the complete annual report
Please find page 34 of the 2015 Napa Auto Parts annual report below. You can navigate through the pages in the report by either clicking on the pages listed below, or by using the keyword search tool below to find specific information within the annual report.-
 1
1 -
2
-
3
-
4
-
5
-
6
-
7
-
8
-
9
-
10
-
11
-
12
-
13
-
14
-
15
-
16
-
17
-
18
-
19
-
20
-
21
-
22
-
23
-
 24
24 -
 25
25 -
 26
26 -
 27
27 -
 28
28 -
 29
29 -
 30
30 -
 31
31 -
 32
32 -
 33
33 -
 34
34 -
 35
35 -
 36
36 -
 37
37 -
 38
38 -
 39
39 -
 40
40 -
 41
41 -
 42
42 -
 43
43 -
 44
44 -
45
-
46
-
47
-
48
-
49
-
50
-
51
-
52
-
53
-
54
-
55
-
56
-
57
-
58
-
59
-
60
-
61
-
62
-
63
-
64
-
65
-
66
-
67
-
68
-
69
-
70
-
71
-
72
-
73
-
74
-
75
-
76
-
77
-
78
-
79
-
80
-
81
-
82
-
83
-
84
-
85
-
86
-
87
-
88
-
89
-
90
-
91
 |
 |

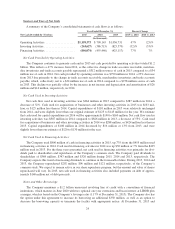
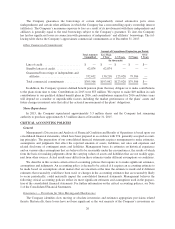
Based on the investment policy for the pension plans, as well as an asset study that was performed based on
the Company’s asset allocations and future expectations, the Company’s expected rate of return on plan assets for
measuring 2016 pension expense or income is 7.83% for the plans. The asset study forecasted expected rates of
return for the approximate duration of the Company’s benefit obligations, using capital market data and historical
relationships.
The discount rate is chosen as the rate at which pension obligations could be effectively settled and is based
on capital market conditions as of the measurement date. We have matched the timing and duration of the
expected cash flows of our pension obligations to a yield curve generated from a broad portfolio of high-quality
fixed income debt instruments to select our discount rate. Based upon this cash flow matching analysis, we
selected a weighted average discount rate for the plans of 4.82% at December 31, 2015.
Net periodic benefit (income) cost for our defined benefit pension plans was ($5.8) million, ($9.6) million
and $51.1 million for the years ended December 31, 2015, 2014 and 2013, respectively. The income associated
with the pension plans in 2015 and 2014 reflects the impact of the hard freeze effective December 31, 2013.
Refer to Note 7 of the Consolidated Financial Statements for more information regarding employee benefit plans.
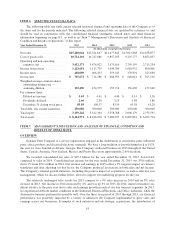
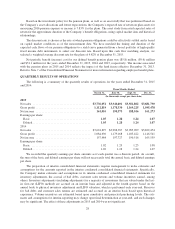
QUARTERLY RESULTS OF OPERATIONS
The following is a summary of the quarterly results of operations for the years ended December 31, 2015
and 2014:
Three Months Ended
March 31, June 30, Sept. 30, Dec. 31,
(In thousands except per share data)
2015
Net sales ....................................... $3,736,051 $3,940,401 $3,921,802 $3,681,790
Gross profit ..................................... 1,112,819 1,178,330 1,169,225 1,095,478
Net income ..................................... 161,010 195,373 188,016 161,273
Earnings per share:
Basic ........................................ 1.05 1.28 1.24 1.07
Diluted ....................................... 1.05 1.28 1.24 1.07
2014
Net sales ....................................... $3,624,897 $3,908,387 $3,985,909 $3,822,454
Gross profit ..................................... 1,084,630 1,179,168 1,183,422 1,146,541
Net income ..................................... 157,484 197,727 190,516 165,559
Earnings per share:
Basic ........................................ 1.02 1.29 1.25 1.08
Diluted ....................................... 1.02 1.28 1.24 1.07
We recorded the quarterly earnings per share amounts as if each quarter was a discrete period. As a result,
the sum of the basic and diluted earnings per share will not necessarily total the annual basic and diluted earnings
per share.
The preparation of interim consolidated financial statements requires management to make estimates and
assumptions for the amounts reported in the interim condensed consolidated financial statements. Specifically,
the Company makes estimates and assumptions in its interim condensed consolidated financial statements for
inventory adjustments, the accrual of bad debts, customer sales returns and volume incentives earned, among
others. Inventory adjustments (including adjustments for a majority of inventories that are valued under the last-
in, first-out (LIFO) method) are accrued on an interim basis and adjusted in the fourth quarter based on the
annual book to physical inventory adjustment and LIFO valuation, which is performed each year-end. Reserves
for bad debts and customer sales returns are estimated and accrued on an interim basis based upon historical
experience. Volume incentives are estimated based upon cumulative and projected purchasing levels. The esti-
mates and assumptions for interim reporting may change upon final determination at year-end, and such changes
may be significant. The effect of these adjustments in 2015 and 2014 was not significant.
28