Napa Auto Parts 2015 Annual Report Download - page 23
Download and view the complete annual report
Please find page 23 of the 2015 Napa Auto Parts annual report below. You can navigate through the pages in the report by either clicking on the pages listed below, or by using the keyword search tool below to find specific information within the annual report.-
 1
1 -
2
-
3
-
4
-
5
-
6
-
7
-
8
-
9
-
10
-
11
-
12
-
 13
13 -
 14
14 -
 15
15 -
 16
16 -
 17
17 -
 18
18 -
 19
19 -
 20
20 -
 21
21 -
 22
22 -
 23
23 -
 24
24 -
 25
25 -
 26
26 -
 27
27 -
 28
28 -
 29
29 -
 30
30 -
 31
31 -
 32
32 -
 33
33 -
34
-
35
-
36
-
37
-
38
-
39
-
40
-
41
-
42
-
43
-
44
-
45
-
46
-
47
-
48
-
49
-
50
-
51
-
52
-
53
-
54
-
55
-
56
-
57
-
58
-
59
-
60
-
61
-
62
-
63
-
64
-
65
-
66
-
67
-
68
-
69
-
70
-
71
-
72
-
73
-
74
-
75
-
76
-
77
-
78
-
79
-
80
-
81
-
82
-
83
-
84
-
85
-
86
-
87
-
88
-
89
-
90
-
91
 |
 |

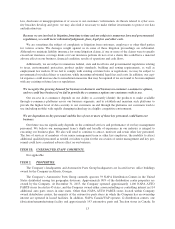
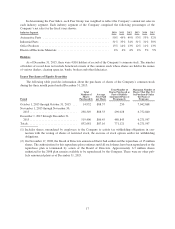
In determining the Peer Index, each Peer Group was weighted to reflect the Company’s annual net sales in
each industry segment. Each industry segment of the Company comprised the following percentages of the
Company’s net sales for the fiscal years shown:
Industry Segment 2010 2011 2012 2013 2014 2015
Automotive Parts ............................................. 50% 49% 49% 53% 53% 52%
Industrial Parts ............................................... 31% 33% 34% 31% 31% 30%
Office Products ............................................... 15% 14% 13% 12% 11% 13%
Electrical/Electronic Materials ................................... 4% 4% 4% 4% 5% 5%
Holders
As of December 31, 2015, there were 4,816 holders of record of the Company’s common stock. The number
of holders of record does not include beneficial owners of the common stock whose shares are held in the names
of various dealers, clearing agencies, banks, brokers and other fiduciaries.
Issuer Purchases of Equity Securities
The following table provides information about the purchases of shares of the Company’s common stock
during the three month period ended December 31, 2015:
Period
Total
Number of
Shares
Purchased(1)
Average
Price Paid
per Share
Total Number of
Shares Purchased as
Part of Publicly
Announced Plans or
Programs(2)
Maximum Number of
Shares That May Yet
be Purchased Under
the Plans or
Programs
October 1, 2015 through October 31, 2015 . . . 14,932 $88.37 250 7,042,868
November 1, 2015 through November 30,
2015 ................................ 298,349 $88.33 290,028 6,752,840
December 1, 2015 through December 31,
2015 ................................ 519,400 $86.45 480,843 6,271,997
Totals ................................. 832,681 $87.16 771,121 6,271,997
(1) Includes shares surrendered by employees to the Company to satisfy tax withholding obligations in con-
nection with the vesting of shares of restricted stock, the exercise of stock options and/or tax withholding
obligations.
(2) On November 17, 2008, the Board of Directors announced that it had authorized the repurchase of 15 million
shares. The authorization for this repurchase plan continues until all such shares have been repurchased or the
repurchase plan is terminated by action of the Board of Directors. Approximately 6.3 million shares
authorized in the 2008 plan remain available to be repurchased by the Company. There were no other pub-
licly announced plans as of December 31, 2015.
17